
European Athletics Championships 2026
PRE-COMPETITION ANALISYS

We present a pre-competition statistical analysis using Google Looker Studio as the analysis platform. The tool is publicly available and free to access.
The underlying data have been collected from the European Athletics website, while record performances have been sourced from World Athletics.
We hope you find the content interesting.
SUMMARY
Objective of the Analysis
The purpose of this analysis is to compare the pre-championship outlook with the final results, looking at the performance of countries, athletes, events and event groups.
Rather than focusing solely on the final rankings, the analysis aims to assess the performance of the athletes throughout the competition and identify how the results compare with the initial expectations.
To facilitate comparisons across different events, performances are converted into Hungarian points. This provides a common measurement scale that allows us to evaluate different events on a comparable basis and to analyse both men’s and women’s competitions using the same methodology.
Methodology
For the evaluation, we have used the athletes’ entry performances and the current European records, with all performances converted into Hungarian points.
The report, created in Google Data Studio (Looker Studio), allows the data to be segmented by country, event group, event, gender and athlete. This makes it possible to perform different comparisons by applying the appropriate filters and analysing the data from the desired perspective.
The analysis covers individual events exclusively; team events are not included.
Using the Interactive Report
Data Selection Controls
At the top of the report, you will find dropdown controls that allow you to segment the information displayed in all subsequent tables and charts by Country, Event Group, Event and Gender.
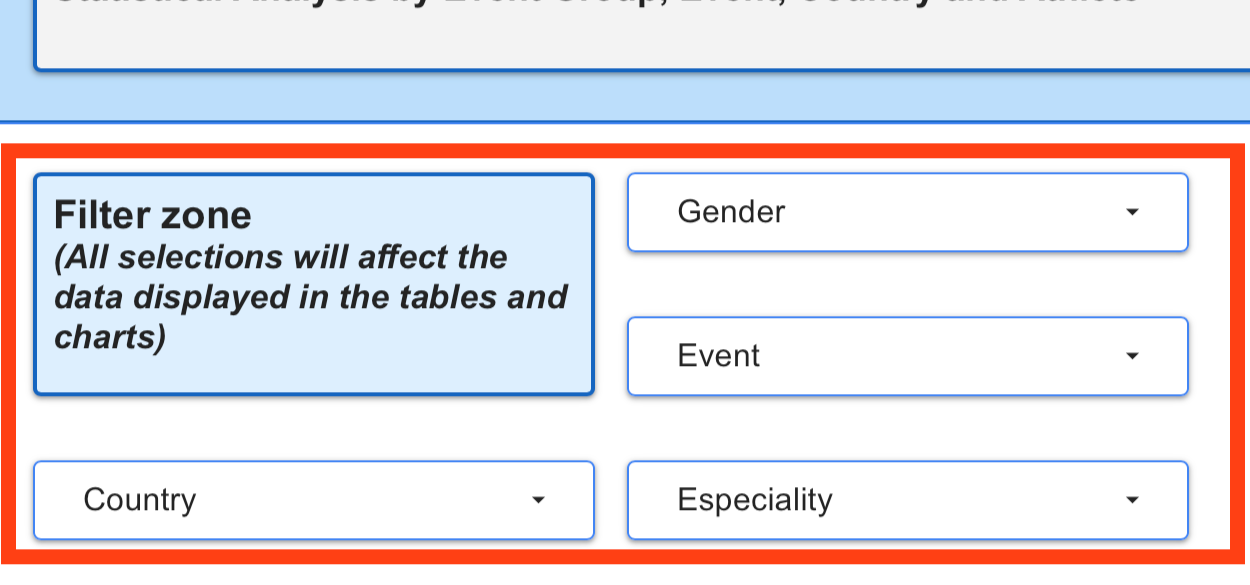
The dropdowns allow you to select one, several or all available options intuitively. The report automatically updates to reflect the selected data.
You can also filter the information by clicking directly on data points in most of the charts and tables throughout the report.
Participants MAP
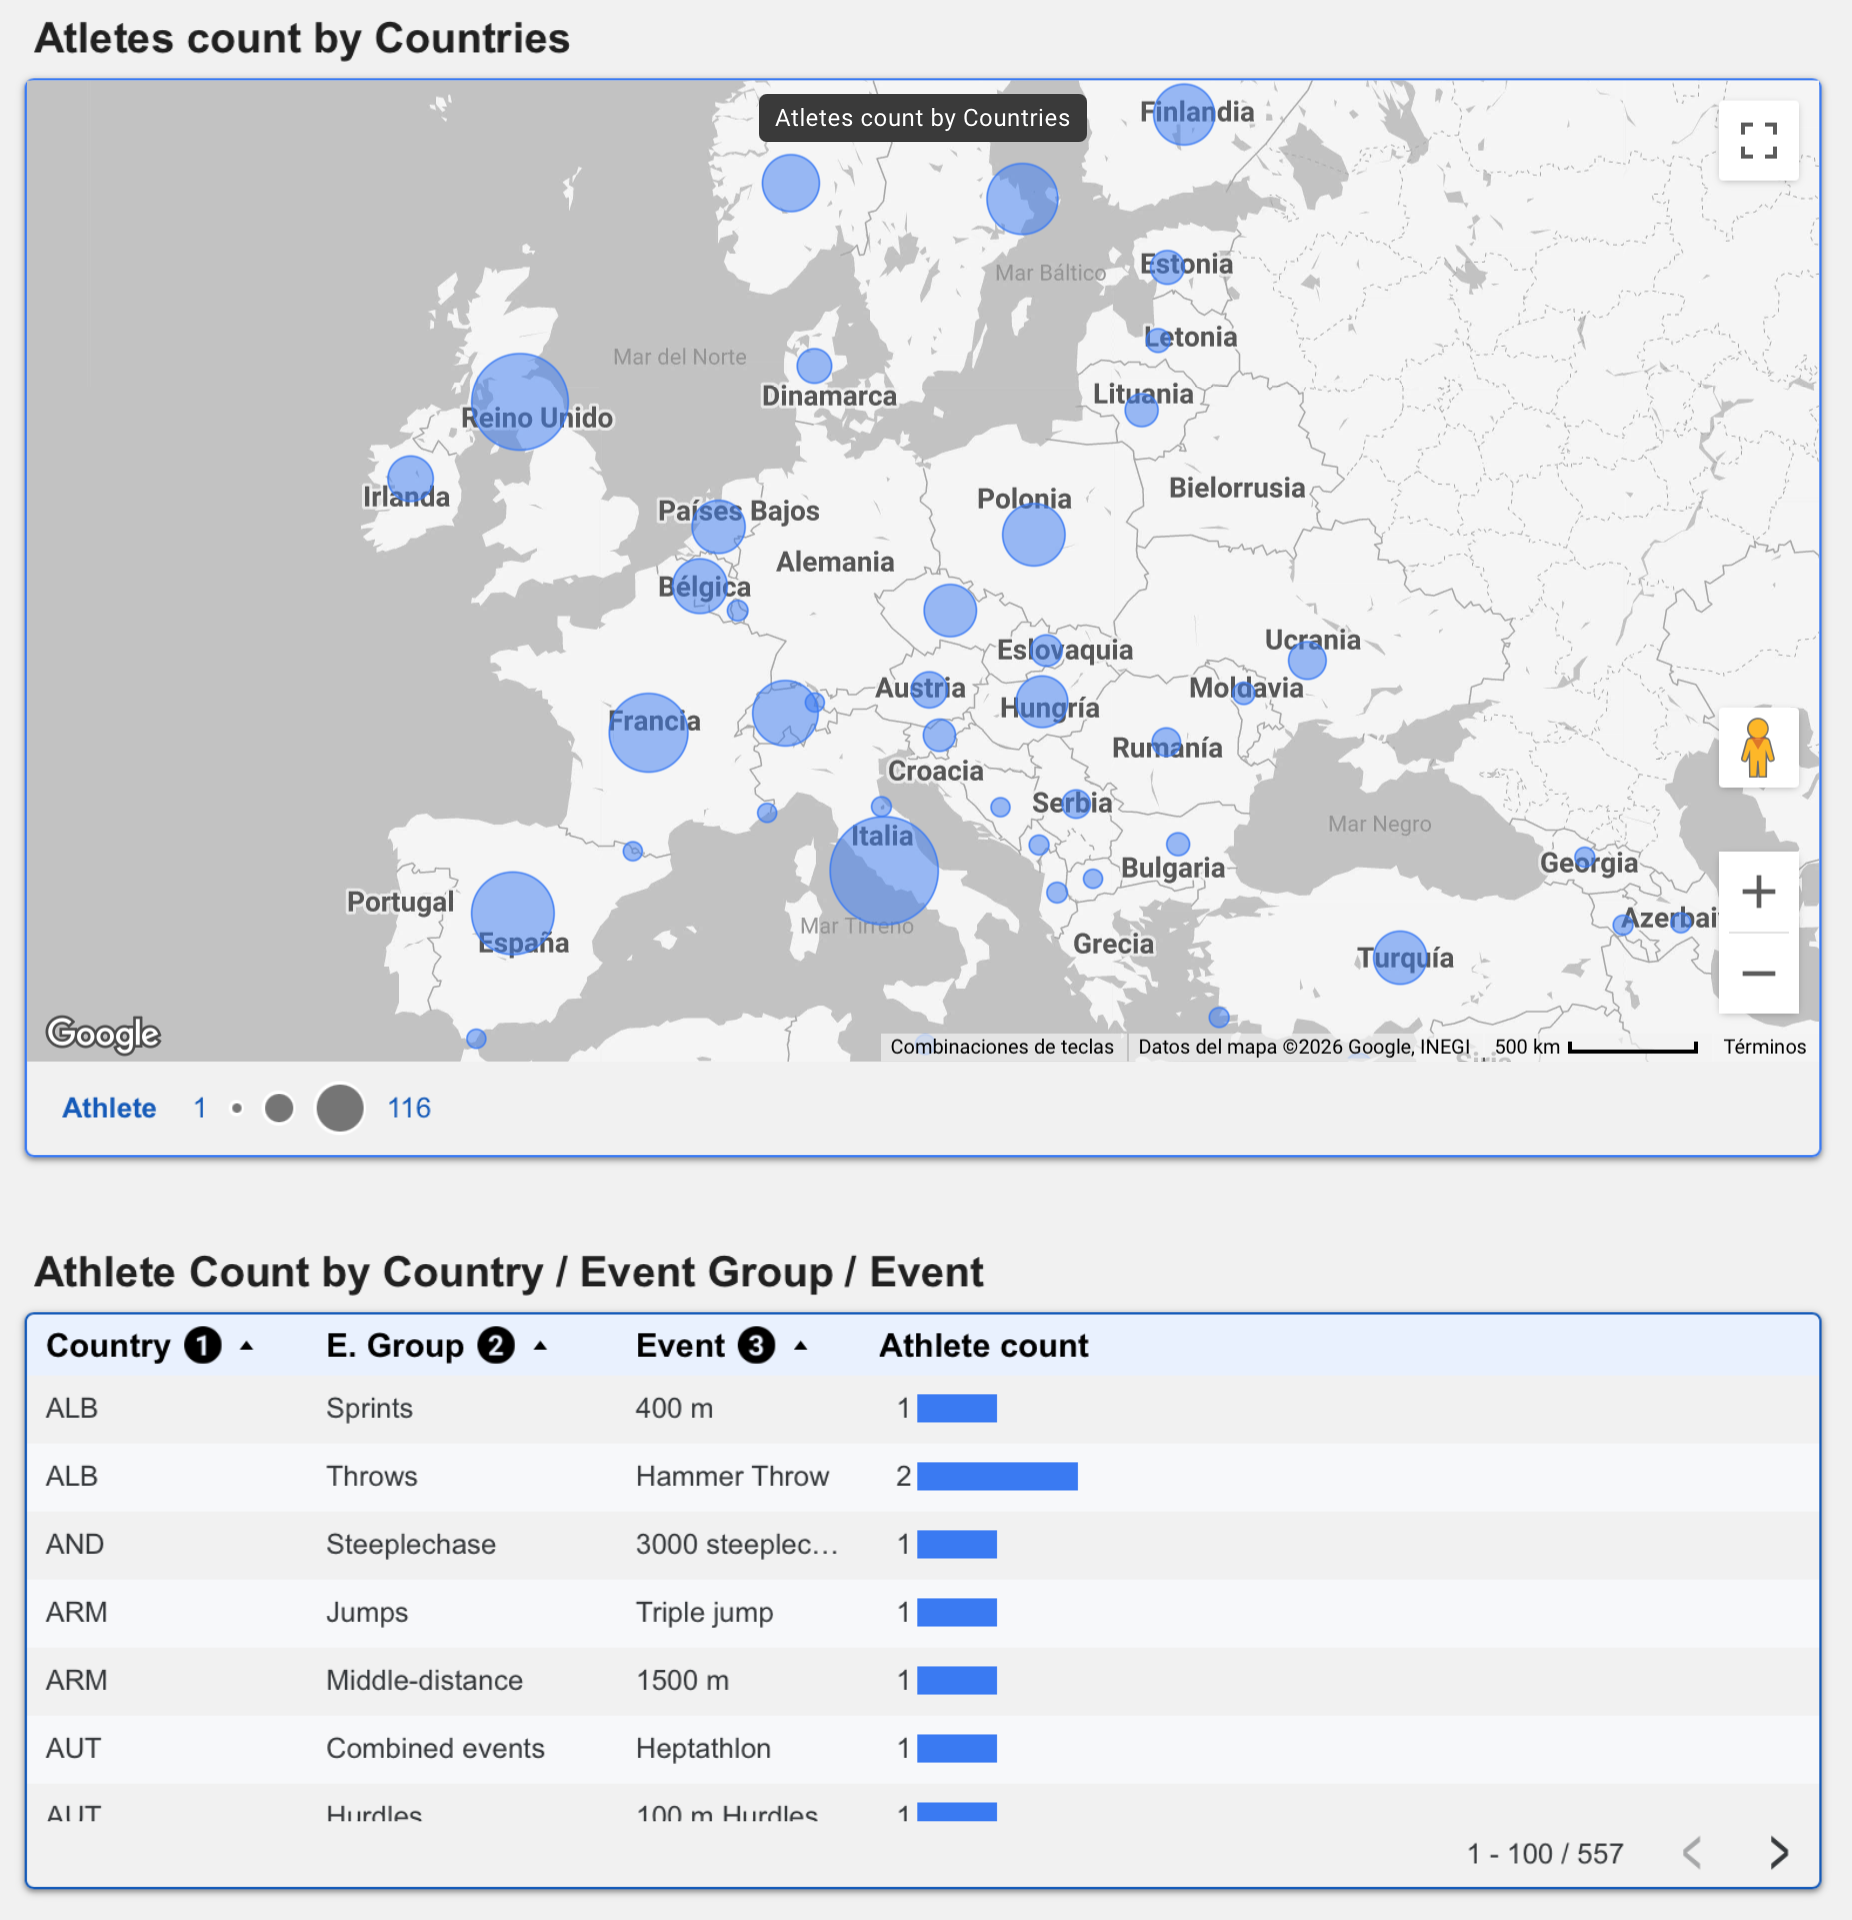
The size of each bubble represents the number of athletes from that country. Clicking on a bubble filters the data to the selected country.
The table below the map shows the number of athletes by country, event group, and event.
The data displayed are affected by the selections made above. This allows you to compare two or more selected countries, or to segment the data by event or event group.
TOP 25 best Athletes
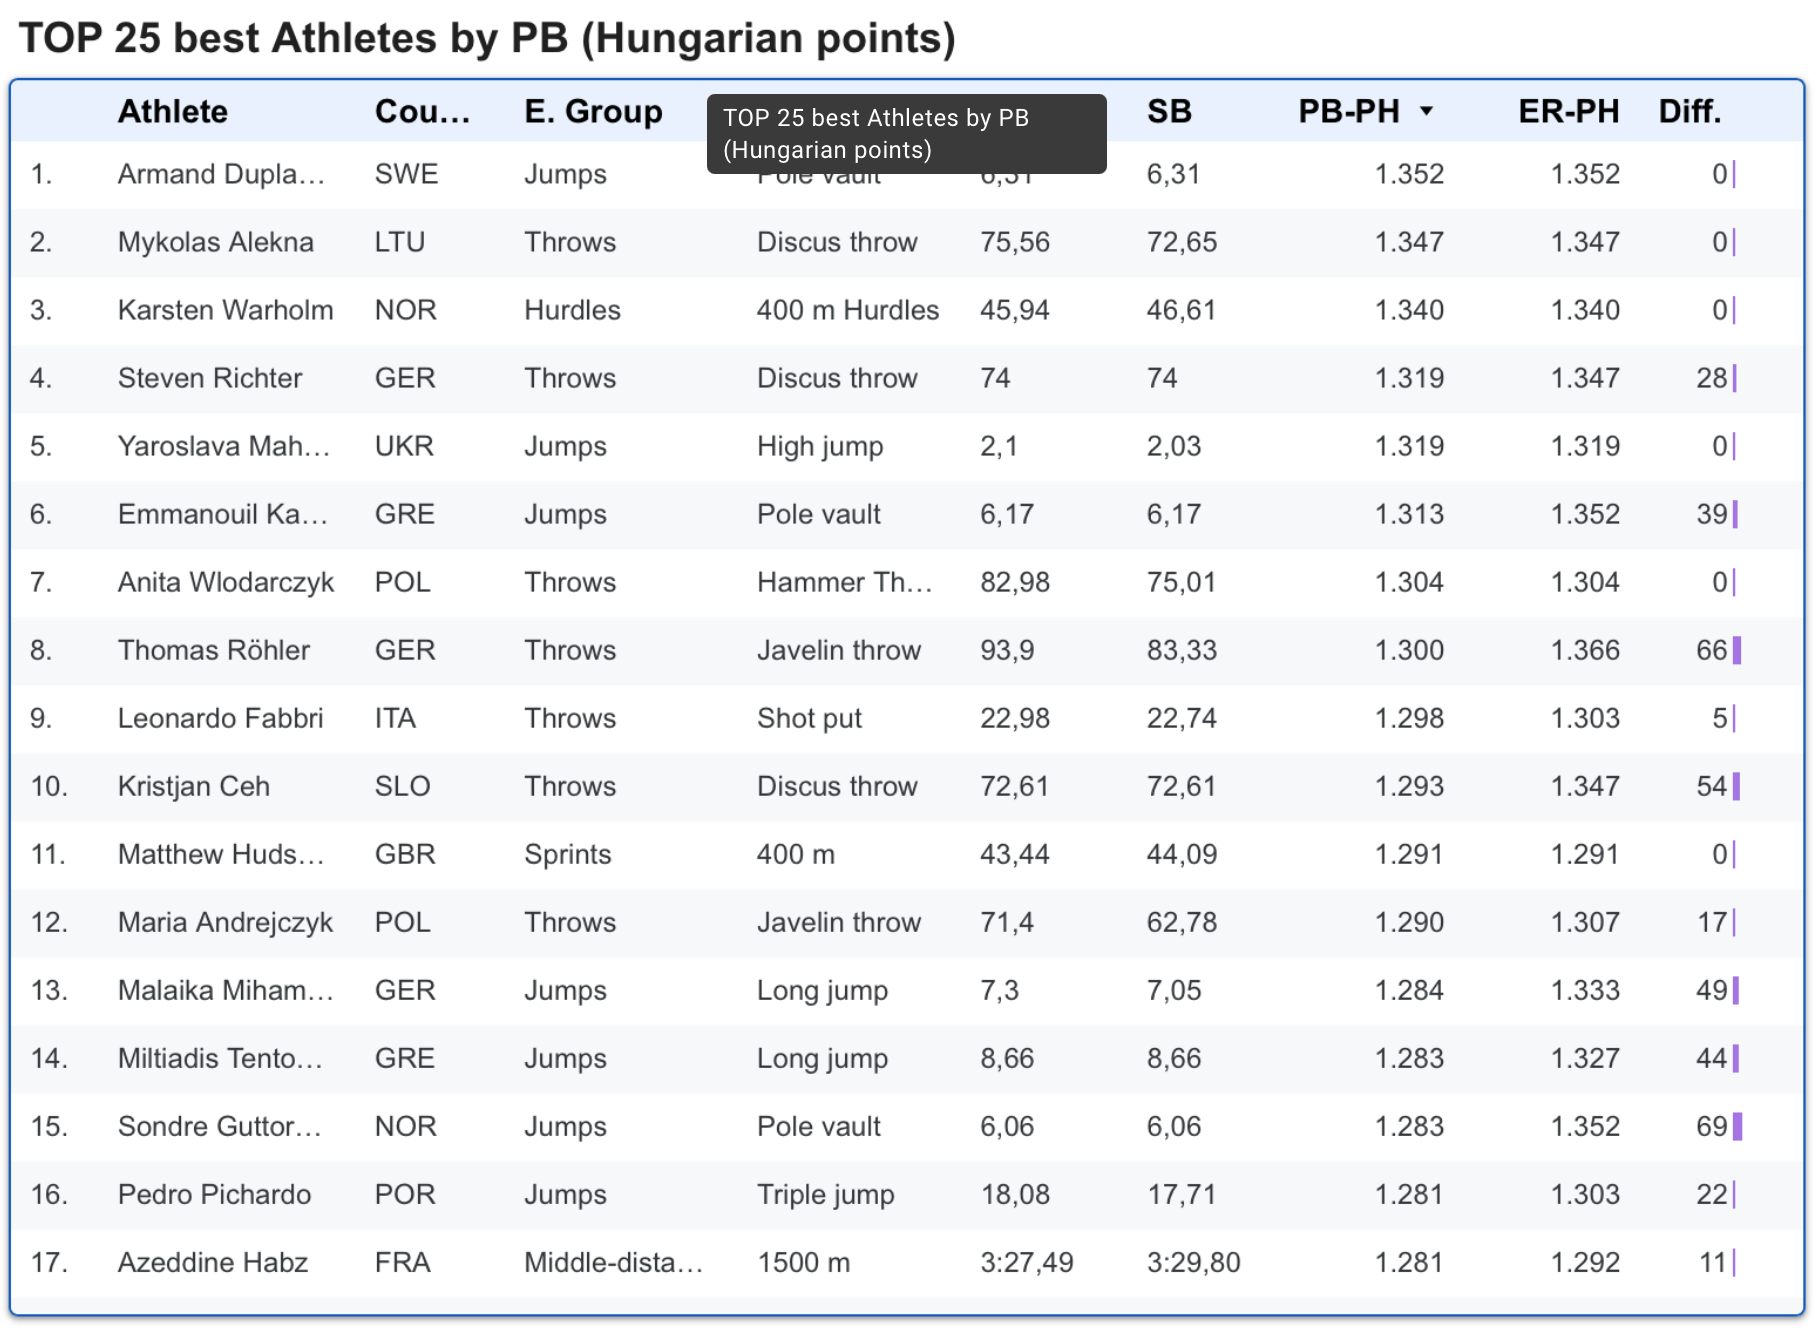
Data for the top 25 athletes, including their respective event groups and events. The table includes PB (Personal Best), SB (Season Best), PB (HP) (Personal Best in Hungarian points), ER-HP (European Record in Hungarian points), and Diff., representing the difference between the European record and the athlete’s personal best.
The data displayed are affected by the selections made above. This allows you to compare two or more selected countries, or to segment the data by event or event group, gender, etc
Best performance by events
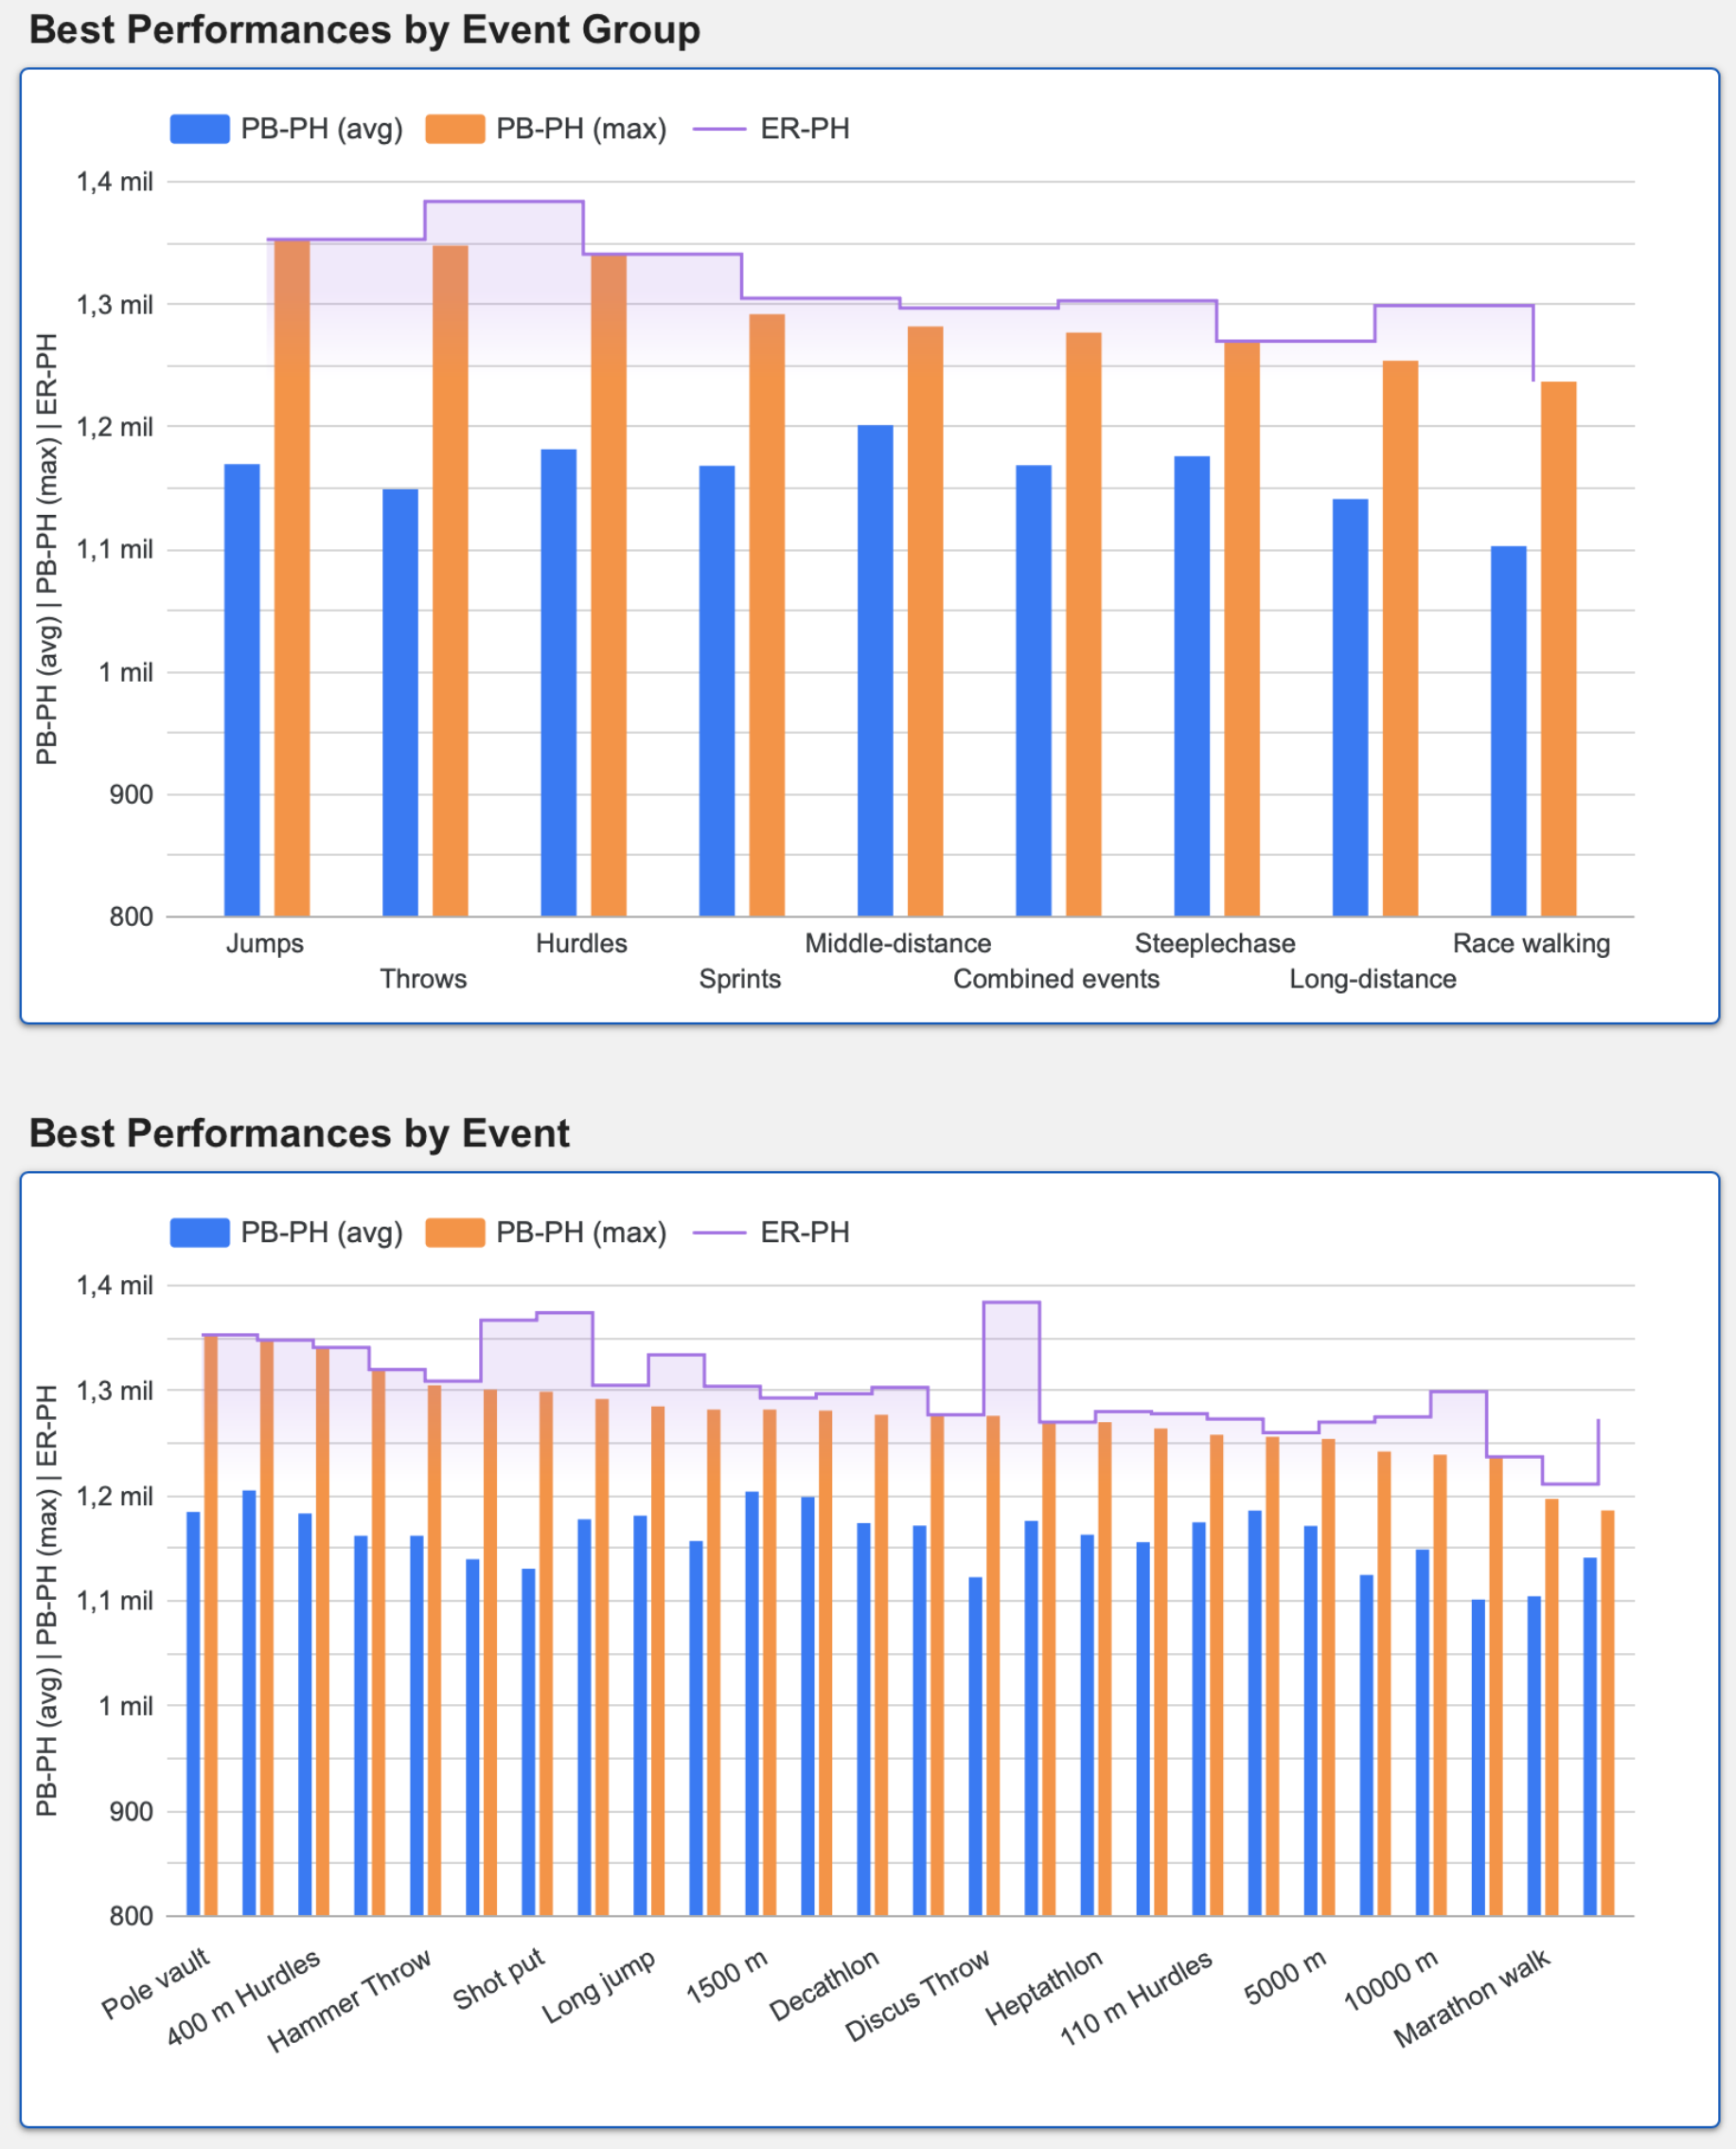
This section presents the best performances by Event Group and Event, expressed in Hungarian points. Specifically, the columns show the average personal best (PB-HP avg.) and the highest personal best (PB-HP max.), while the stepped line represents the European records.
Choose one group event to see the event details in the graphic below- Please remember that you can filter these data using the dropdown controls above or by clicking on any of the charts.
European records status
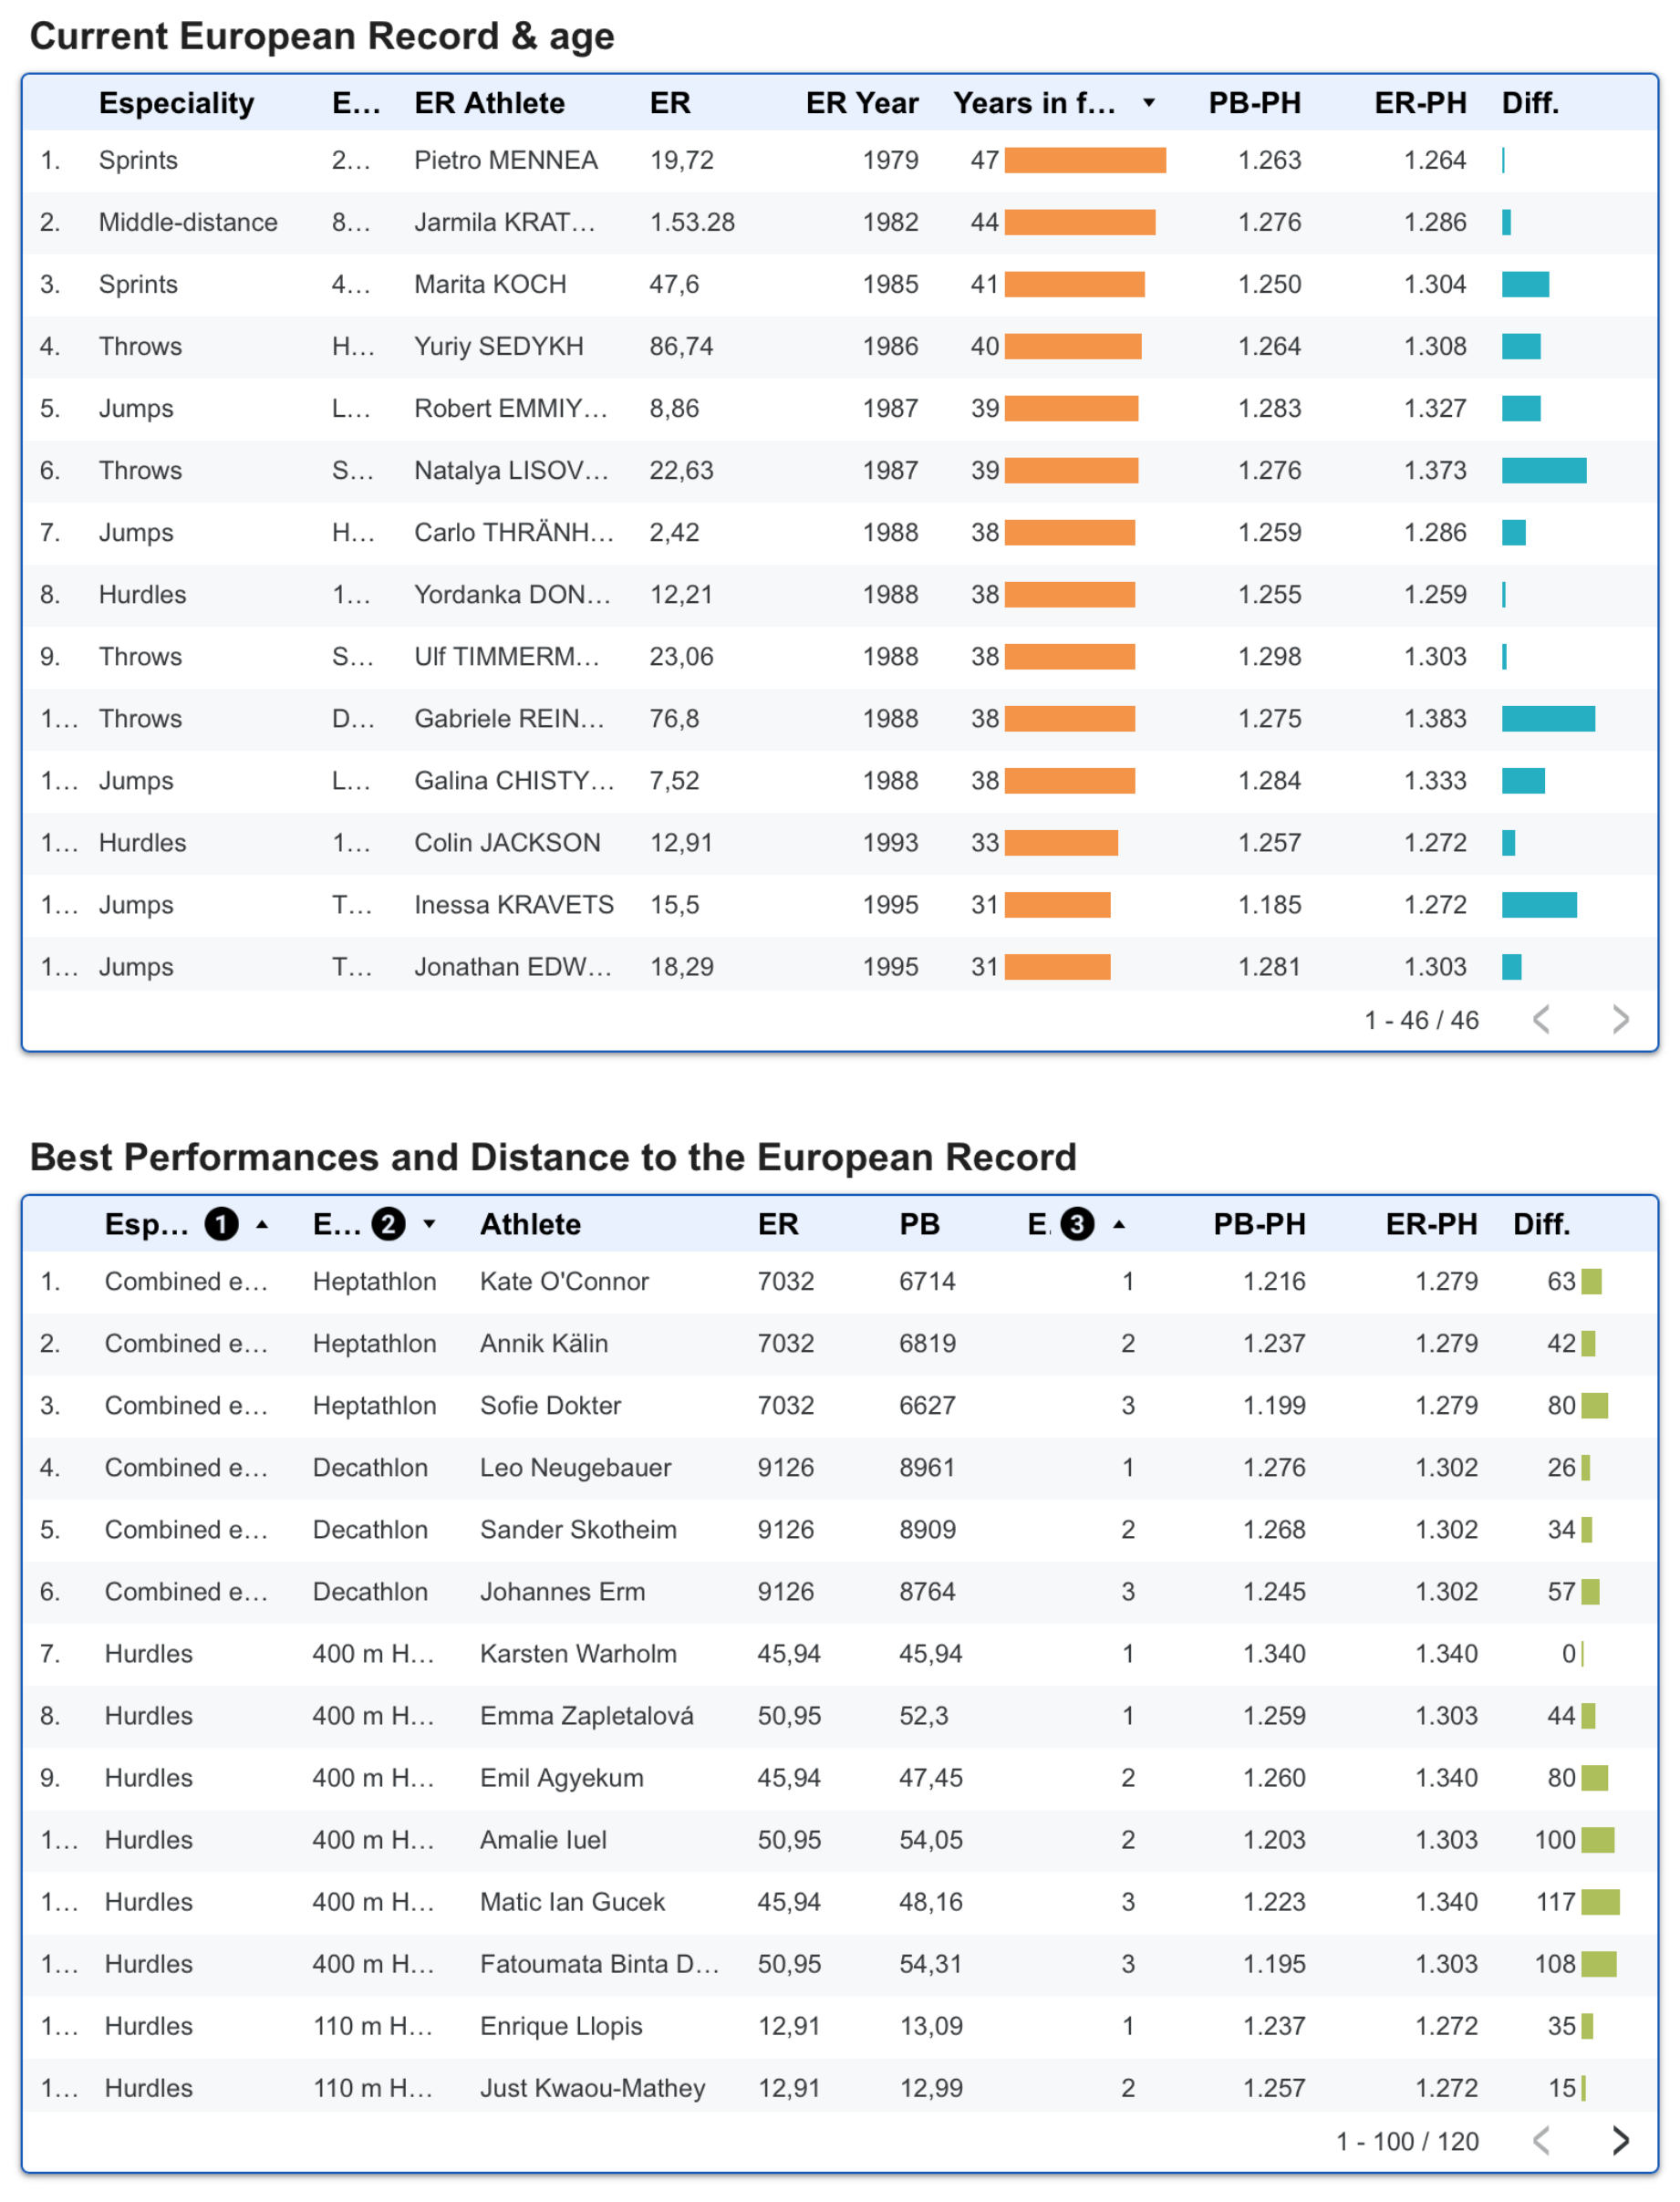
The table shows the current European records for each event, including the athlete, the record mark (ER), the year it was set (ER Year), the number of years it has been in force, the Hungarian points of the best participating performance (PB-HP), the Hungarian points of the record (ER-HP), and the difference between them (Diff.).
The table below shows the three best performances (with a recorded mark), including the personal best, European record, both expressed in Hungarian points, and the difference in points from the record.
Please remember that you can filter these data using the dropdown controls above or by clicking on any of the charts.
Expected Medals by Country
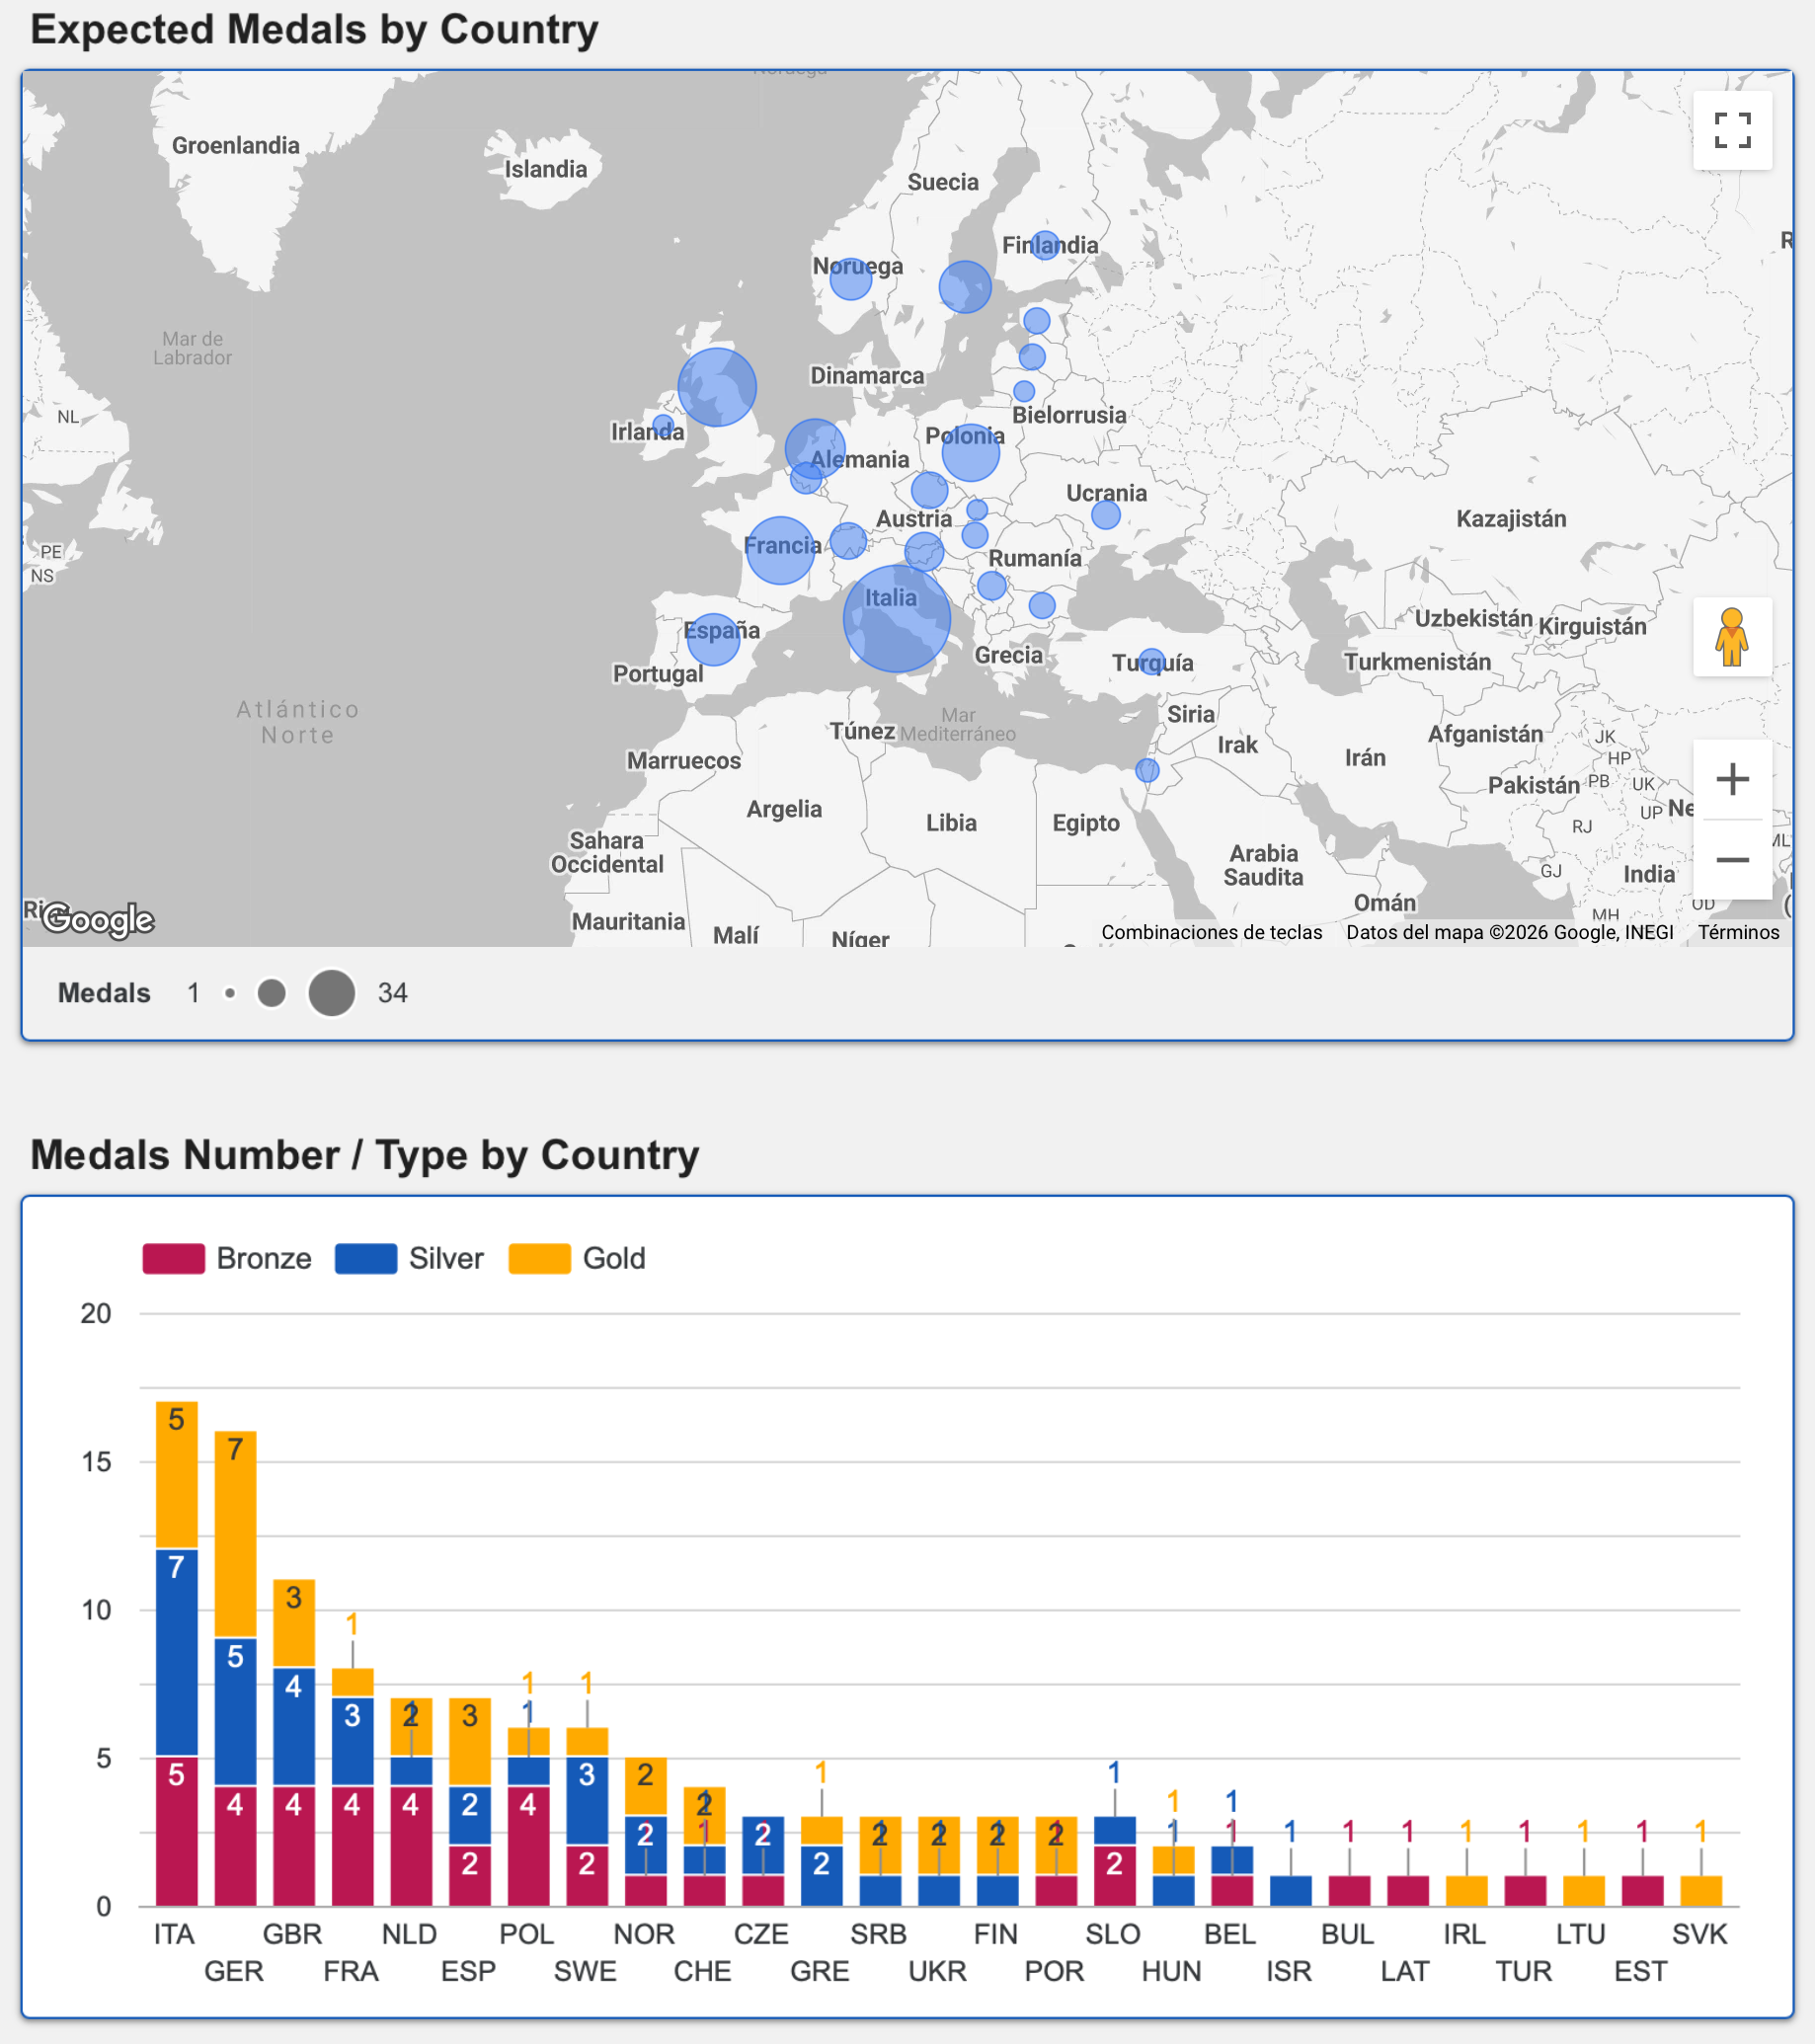
The map shows the expected number of medals for each country based on the qualifying performances, while the chart below shows the expected medal breakdown according to these performances.
Please remember that you can filter these data using the dropdown controls above or by clicking on any of the charts.
INTERACTIVE REPORT
The report is embedded here for your convenience. In the shaded toolbar at the bottom of the report, you will find two links: one to open the report in full-screen mode and another to open it directly in Google Data Studio.
For greater flexibility, we recommend opening the report directly in Google Data Studio. It is safe and free to use.
That’s all for now. We plan to follow up with a further analysis based on the competition results, including performance statistics comparing the athletes’ entry performances with their final results.
Any comments or suggestions are very welcome.
Thank you for your attention.
