
DECATHLON IN EUROPE: 25 YEARS STATISTIC ANALYSIS
First of all, let me introduce myself.
I am an athletics photographer and a passionate fan of the sport. Professionally, I have a background in data analysis, working with advanced tools to develop reports and extract insights.
While I am not an expert in athletics itself, the following analysis and conclusions are strictly based on statistical evidence.
In this study, I aim to analyze the evolution and performance of the decathlon in Europe over the past 25 years, including the impact of each event (and event groups) on the final result, as well as how these parameters have evolved over time.
The raw data used in this analysis has been collected from the World Athletics scoring tables and has been carefully prepared to ensure accurate and meaningful results.
OVERVIEW
OBJETIVE OF THE ANALYSIS
We aim to provide an overview of the evolution of the decathlon in Europe, highlighting its key contributors—countries and athletes—and the relative weight of each combined event in the final result.
DATA DESCRIPTION
The data correspond to the top 10 athletes in the European ranking for each year. It includes total performances (Mark), Hungarian scoring points (Result), and event-by-event results, both in actual performances and in Hungarian points. Athletes’ personal bests, expressed in Hungarian points, have also been included.
To better segment the information, the following variables have been included: the athlete’s country, the competition venue, and the current population of each country, in order to derive certain ratios.
INTERACTIVE REPORTS
Each section includes interactive reports created in Google Datastudio, allowing users to segment, filter, and compare the presented data. While we believe the reports are fairly intuitive to use, we provide below a brief guide to help you get started. Please feel free to interact with the reports; however, if you have any questions, you are welcome to leave a comment or contact us by email.
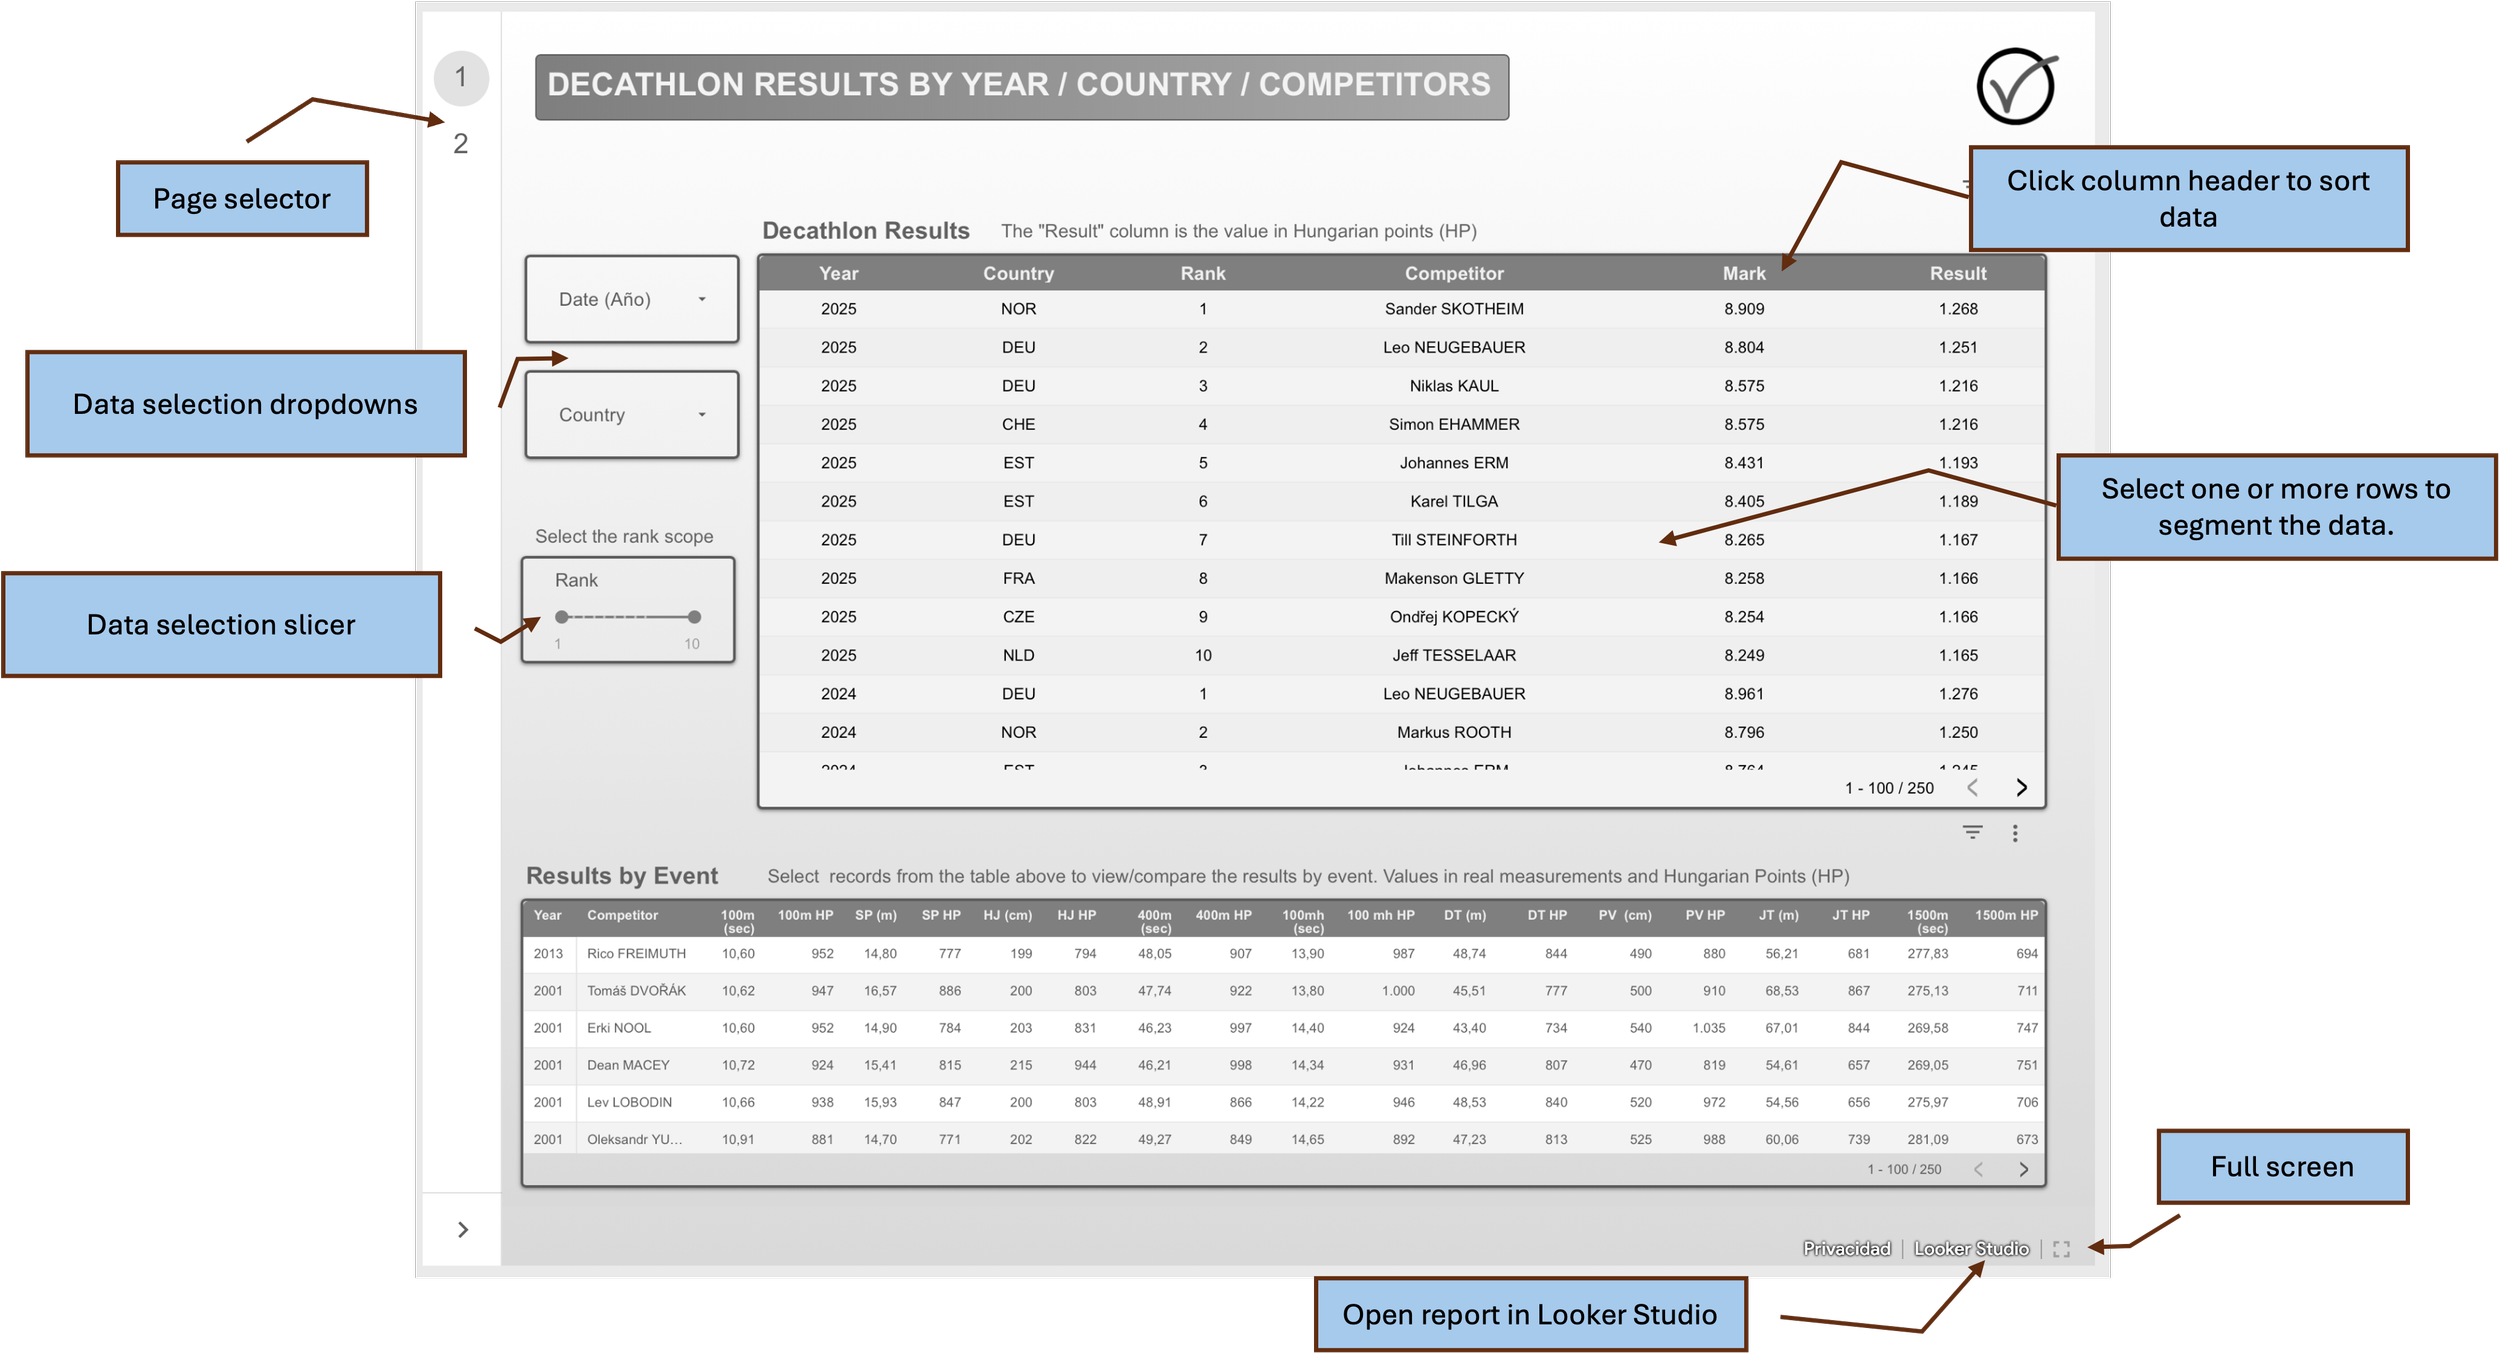
To access each report, please click on the image shown. A new window will open with the selected report page.
For a better experience, we recommend viewing this on a desktop or tablet.
DECATHLON RESULTS
To begin, let us look at the decathlon results over the past 25 years.
The best performance was achieved by the French athlete Kevin Mayer, with 9,126 points in 2018, which remains the current European record. This is followed by the Czech athlete Roman Šebrle, who scored 9,026 points in 2001. The official ranking from World Athletics can be consulted here.
Report page 1: Results
The following report allows users to filter results by year and country, displaying both total performances and Hungarian points, along with a table detailing performances and points for each event.
It also allows users to refine the displayed results by selecting ranking positions from 1 to 10 for each year (Rank).
Report page 2: Evolution by year / country
On the second page of the report, the chart displays the annual evolution of the selected country or countries, based on the corresponding control. Users can also filter by year and refine ranking positions. The table below lists the results, while the pie chart shows the percentage of representatives by country within the selected range.
It appears evident that, on average, performances have improved during the final third of the period, regardless of the selected participant range. This is consistent with the overall improvement in athletics in recent years.
Click on the image to access the report (opening in a new tab)
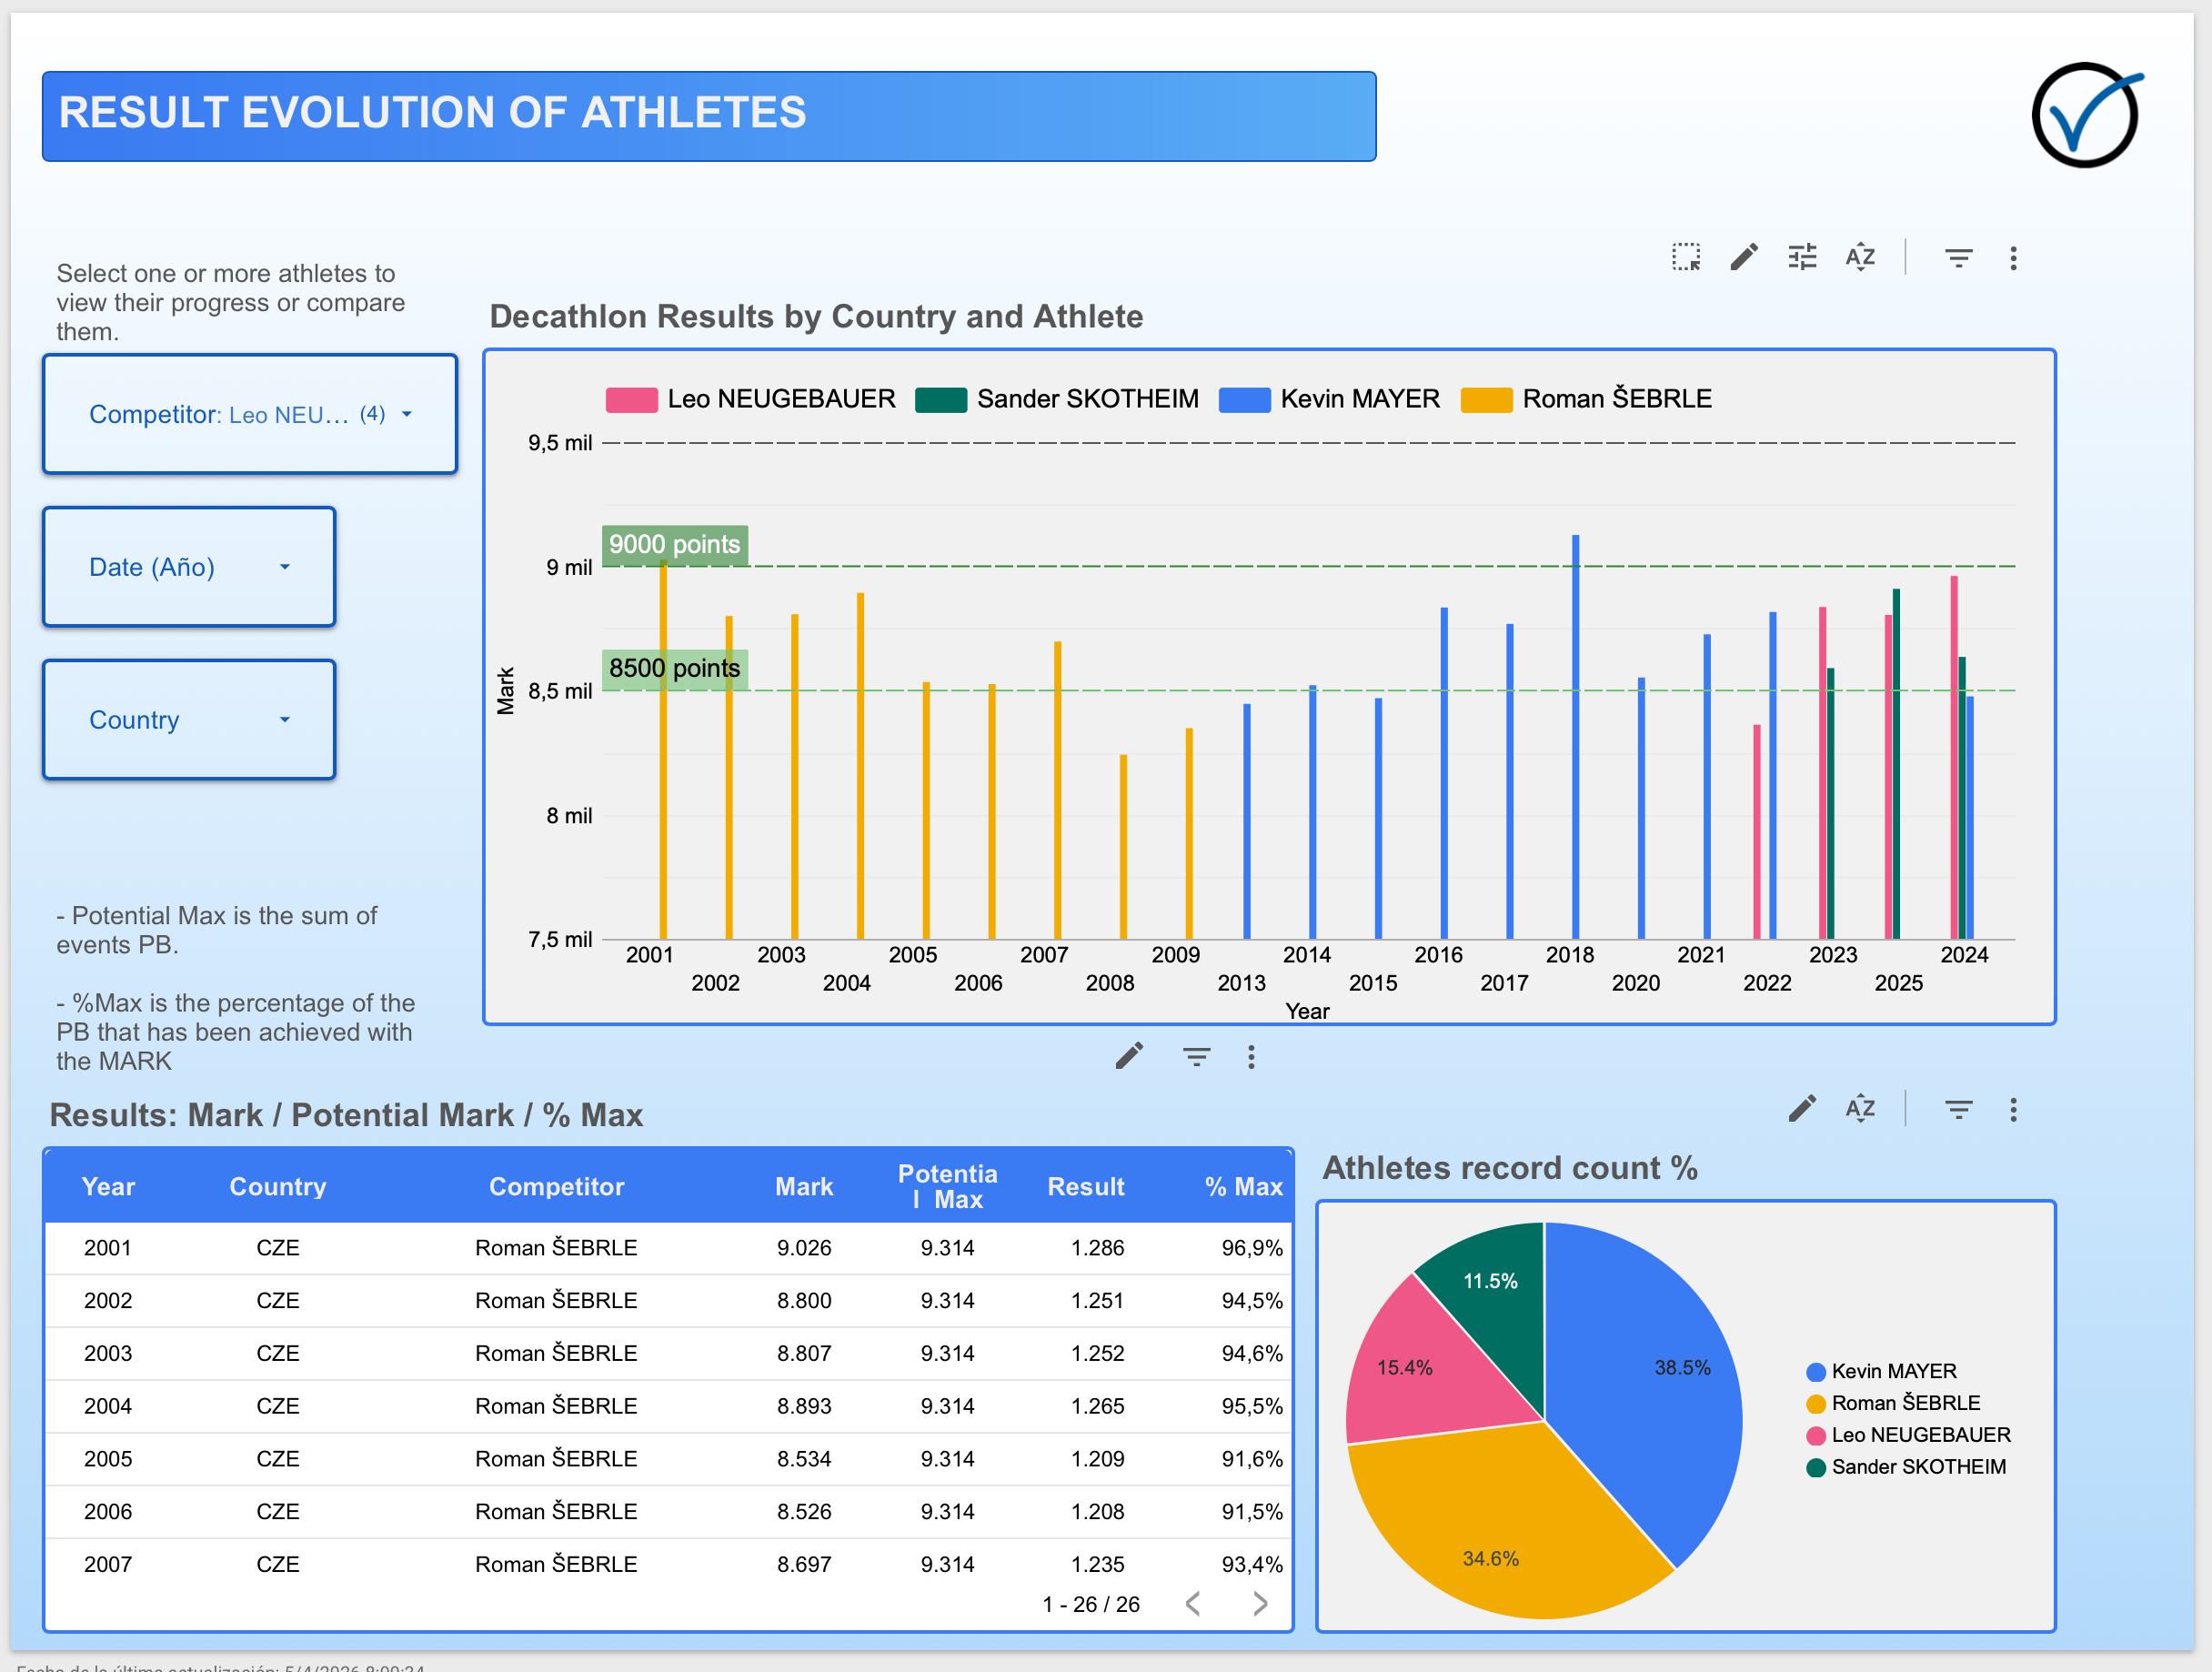
ATHLETES: RESULTS & PERFORMANCE
The following report presents and compares results with a focus on athletes, including their personal best performances overall and in each event, in order to assess their performance in each competition.
Report page 3:Athletes evolution
Once the desired filters have been applied using the dropdowns, the chart displays the year-by-year progression of athletes and their performances, allowing users to track their development and compare results.
The table below shows, for each year and athlete, the performance, their potential performance—derived from the sum of their personal bests across all events—and the % Max, which represents the ratio between actual and potential performance, providing an indication of the athlete’s efficiency in each competition.
Report Page 4: Athletes PB’s by events
Users can select multiple athletes and view, in the upper chart, the Hungarian points corresponding to their best performances in each event. The lower chart presents the same information grouped by event type, helping to identify each athlete’s strengths (throws, jumps, hurdles, etc.). It is recommended to select no more than 3–4 athletes to ensure an effective comparison.
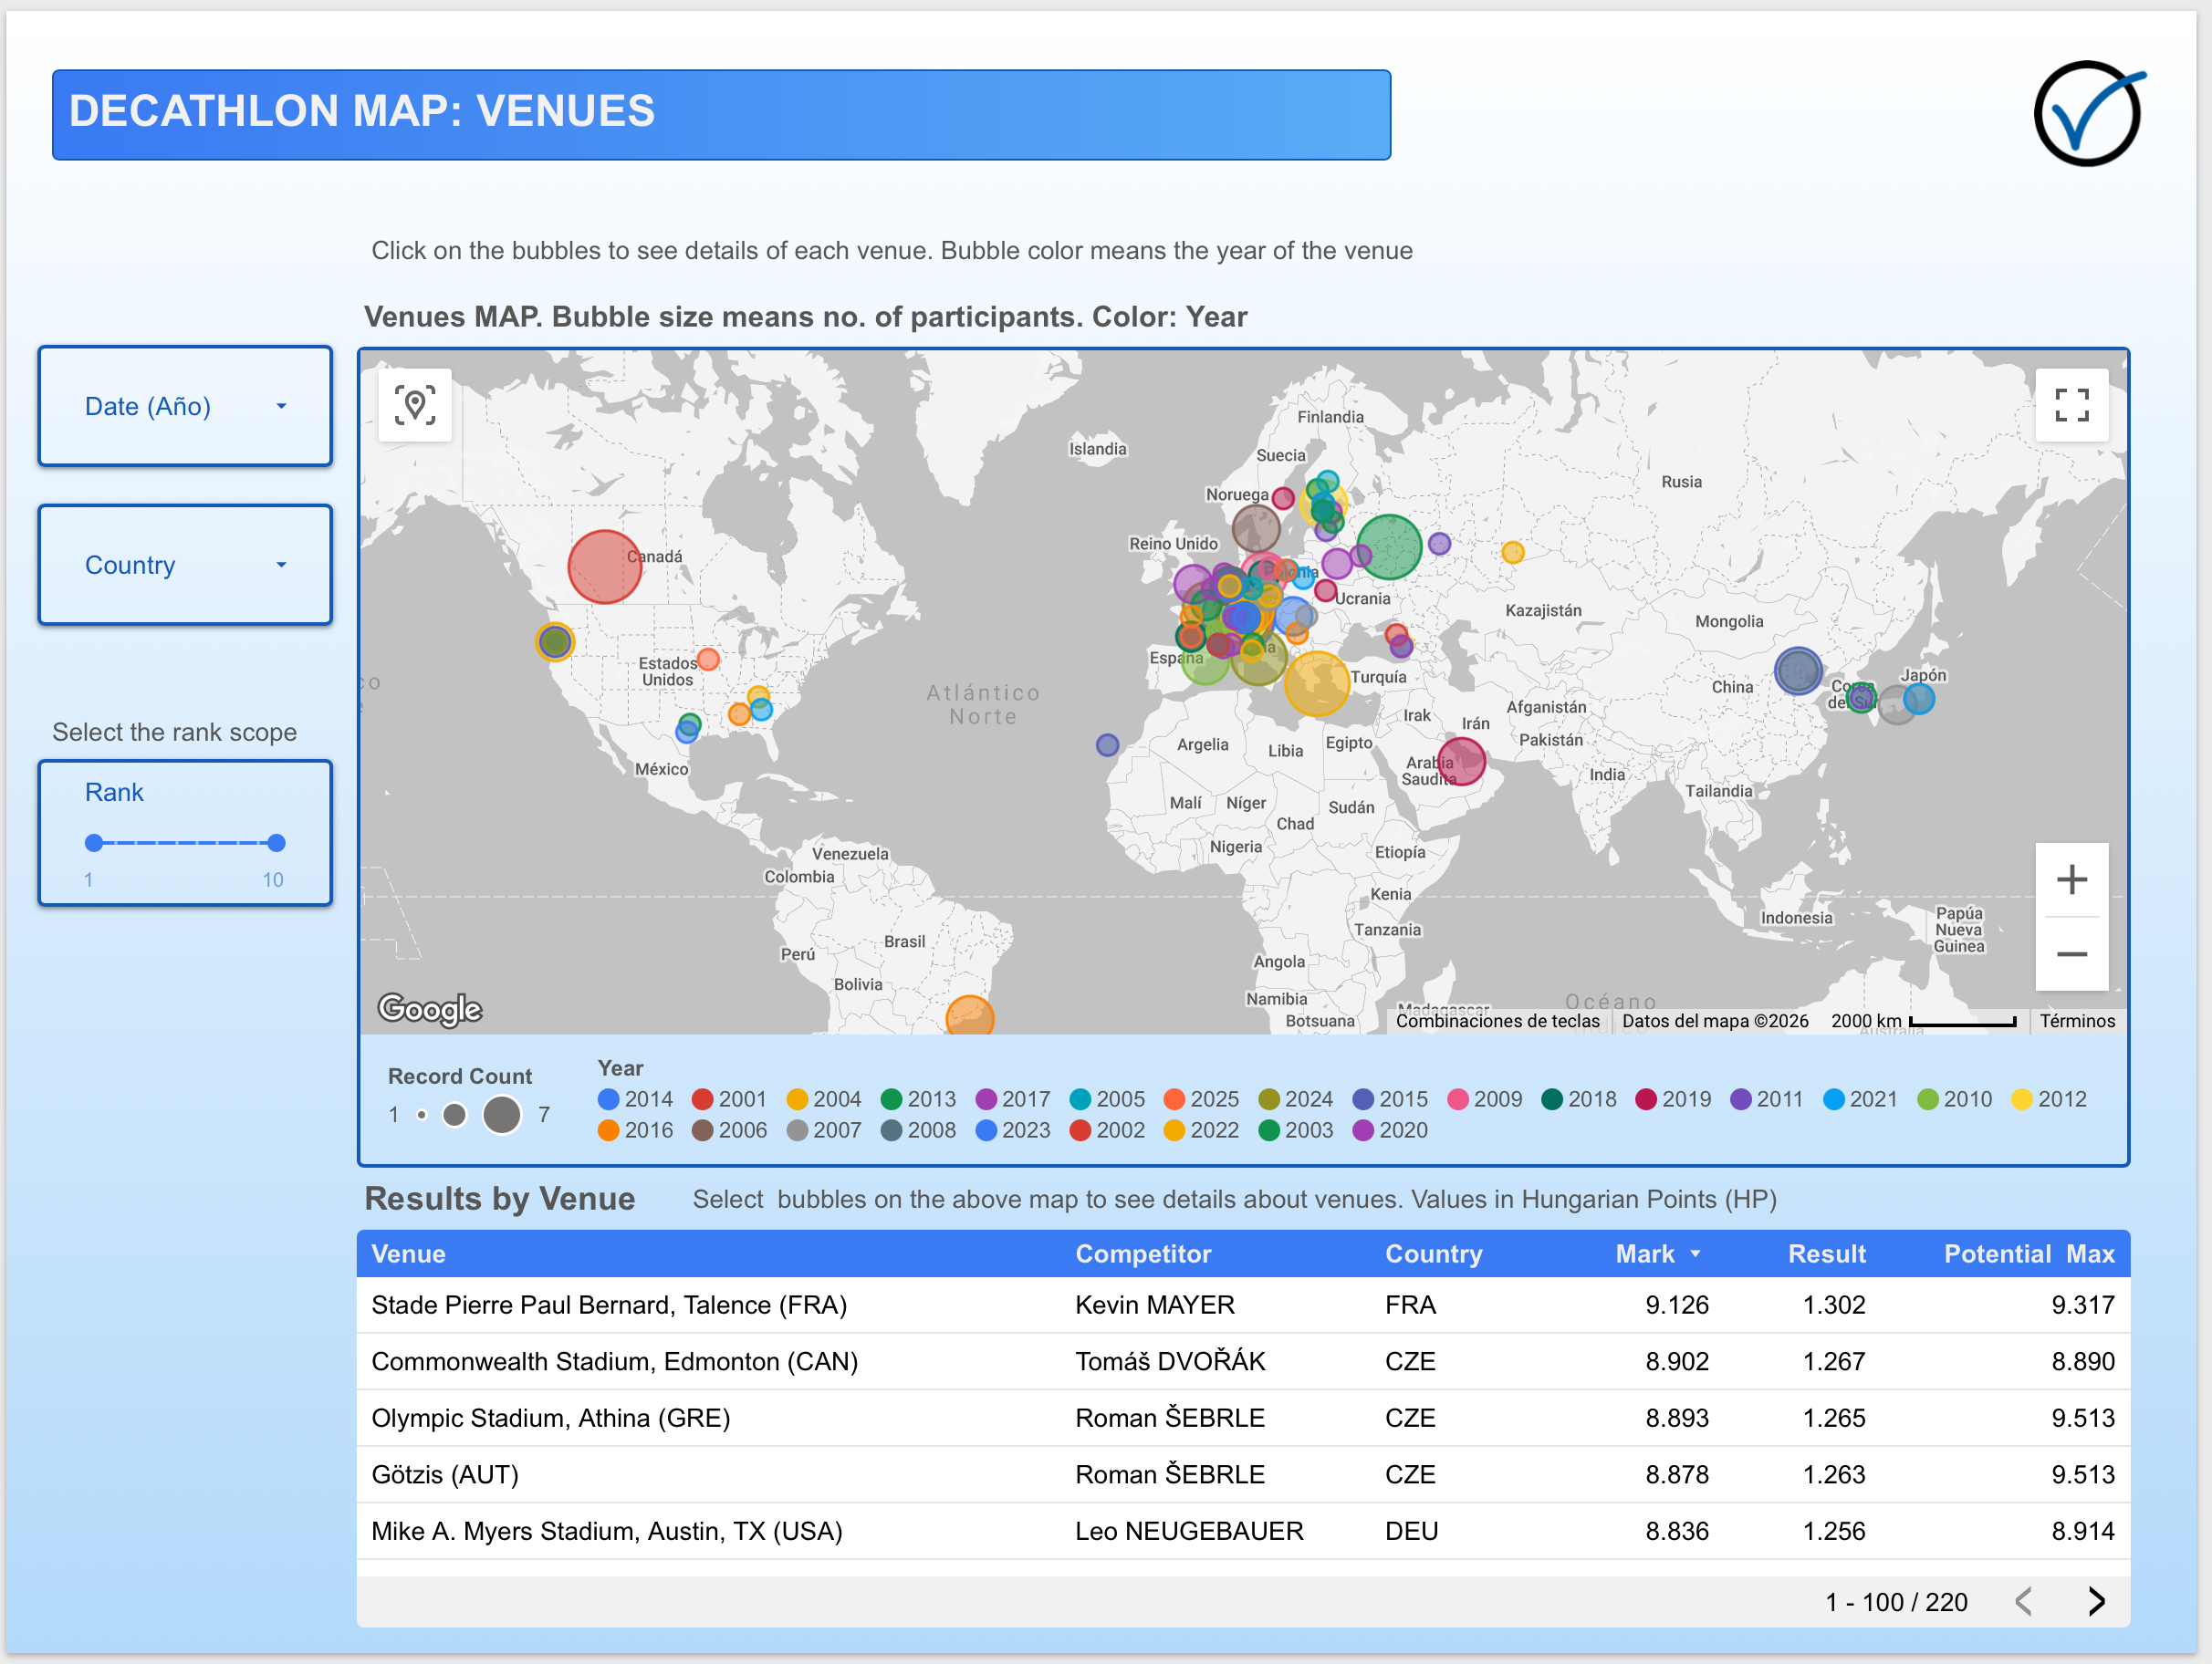
DECATHLON MAP
In this section, we analyze results across different competition venues, as well as the impact of the decathlon in each country, considering its population and number of participants.
Report page 5: Decathlon venues map
This page displays a map with the different event locations. The size of the bubbles represents the number of European participants within the selected range, while the color of each bubble indicates the year of the event.
Report page 6: Decathlon map: participants / population ratio
On page 5, we present a map where the color of the bubbles reflects the population of each country (2025 data), while their size represents the ratio of participants per million inhabitants. Users can also filter by year and refine the ranking range from 1 to 10 using the slider control.
It is noteworthy that Estonia shows a high ratio, with a relatively large number of participations given its small population.
Events Analysis
Finally, we analyze the individual decathlon events, the performances achieved, the evolution of athletes, and the impact of each event on the overall result by country.
Report page 7: Events top 10 marks
Here, we present the ranking of performances both in their standard units and in Hungarian points, with the option to filter by event and by the number of athletes included in the analysis.
Report page 8: Progression of Event Results by Athlete
In this report, users can view the event-by-event progression of each athlete by selecting them from the dropdown. The table below displays performances both in actual measurements and in Hungarian points.
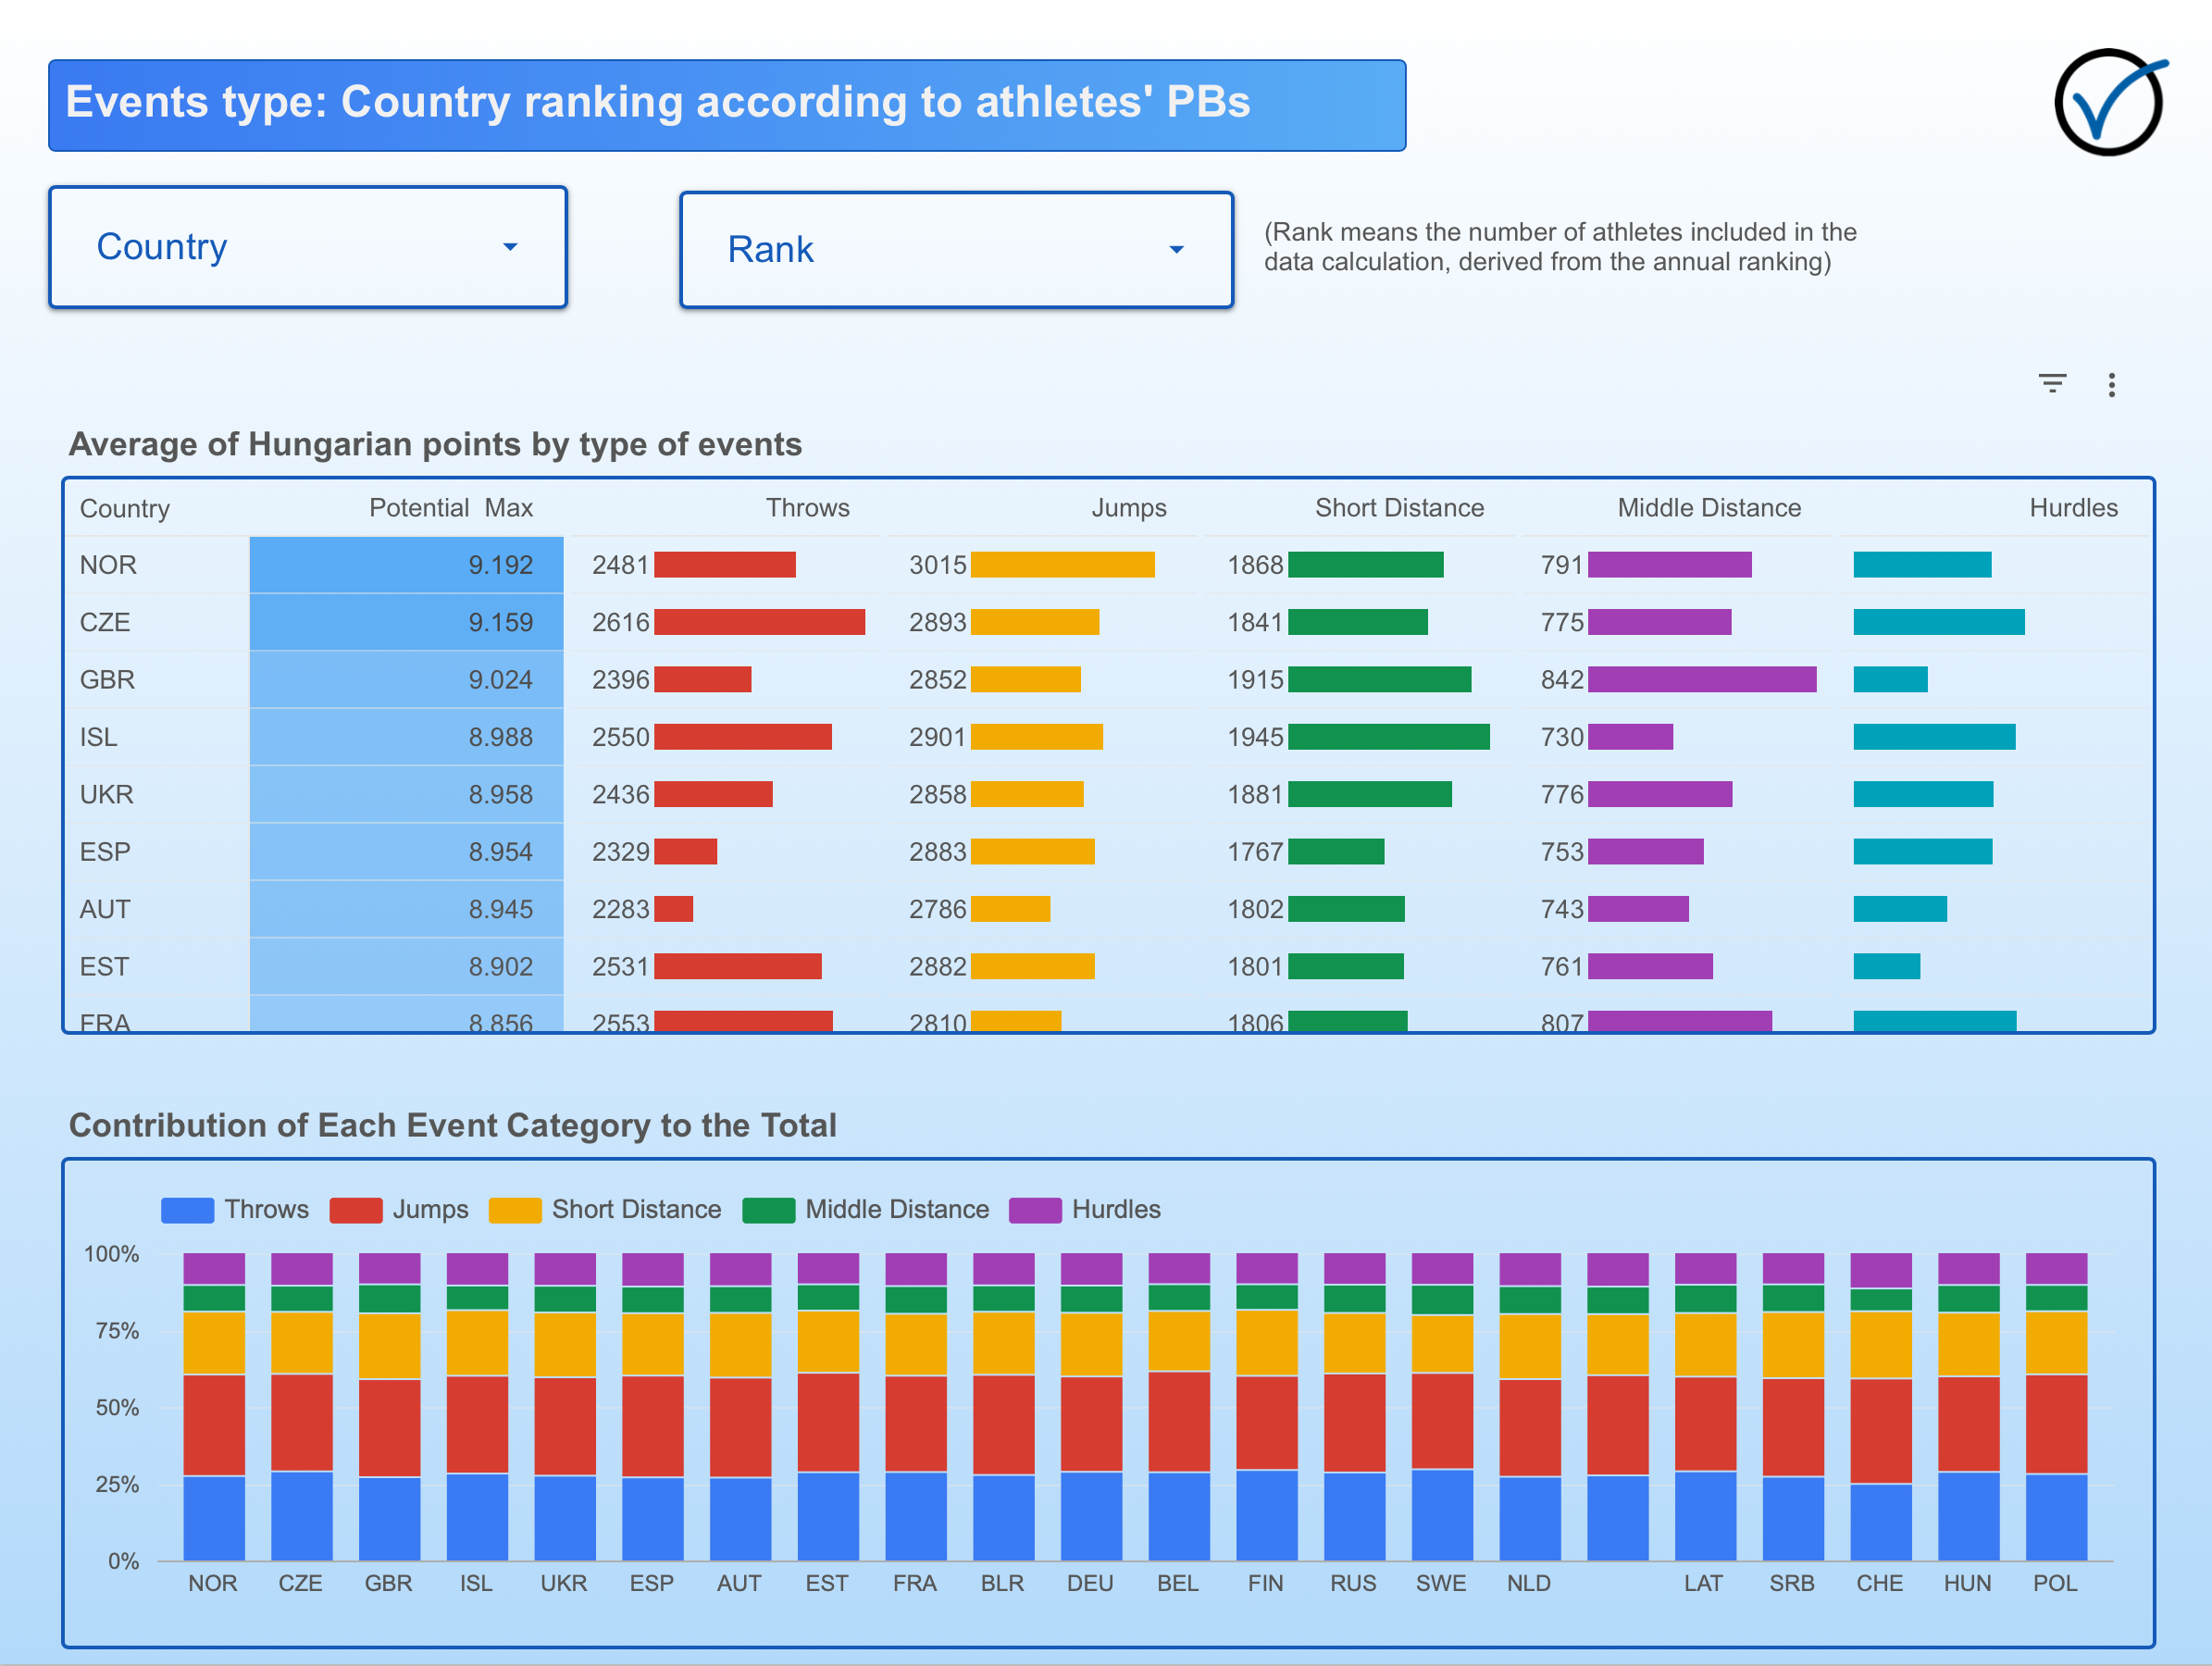
Report page 9: Country ranking according to athletes’s PBs
On the final page, we present the classification by event type and by country, based on athletes’ personal best performances and calculated as averages. The “Rank” selector allows users to define how many positions (from 1 to 10) are included in the calculation. The table below shows the percentage contribution of each event type, summing up to 100% of the total points.
CONCLUSION
This is all for now. We hope you found this analysis of interest. Any questions regarding the data modeling, as well as any suggestions, are most welcome.
We encourage you to leave your comments. Thank you.