
Statistical Analysis of the Impact of Doping on Athletics (2000-2025) - PART I
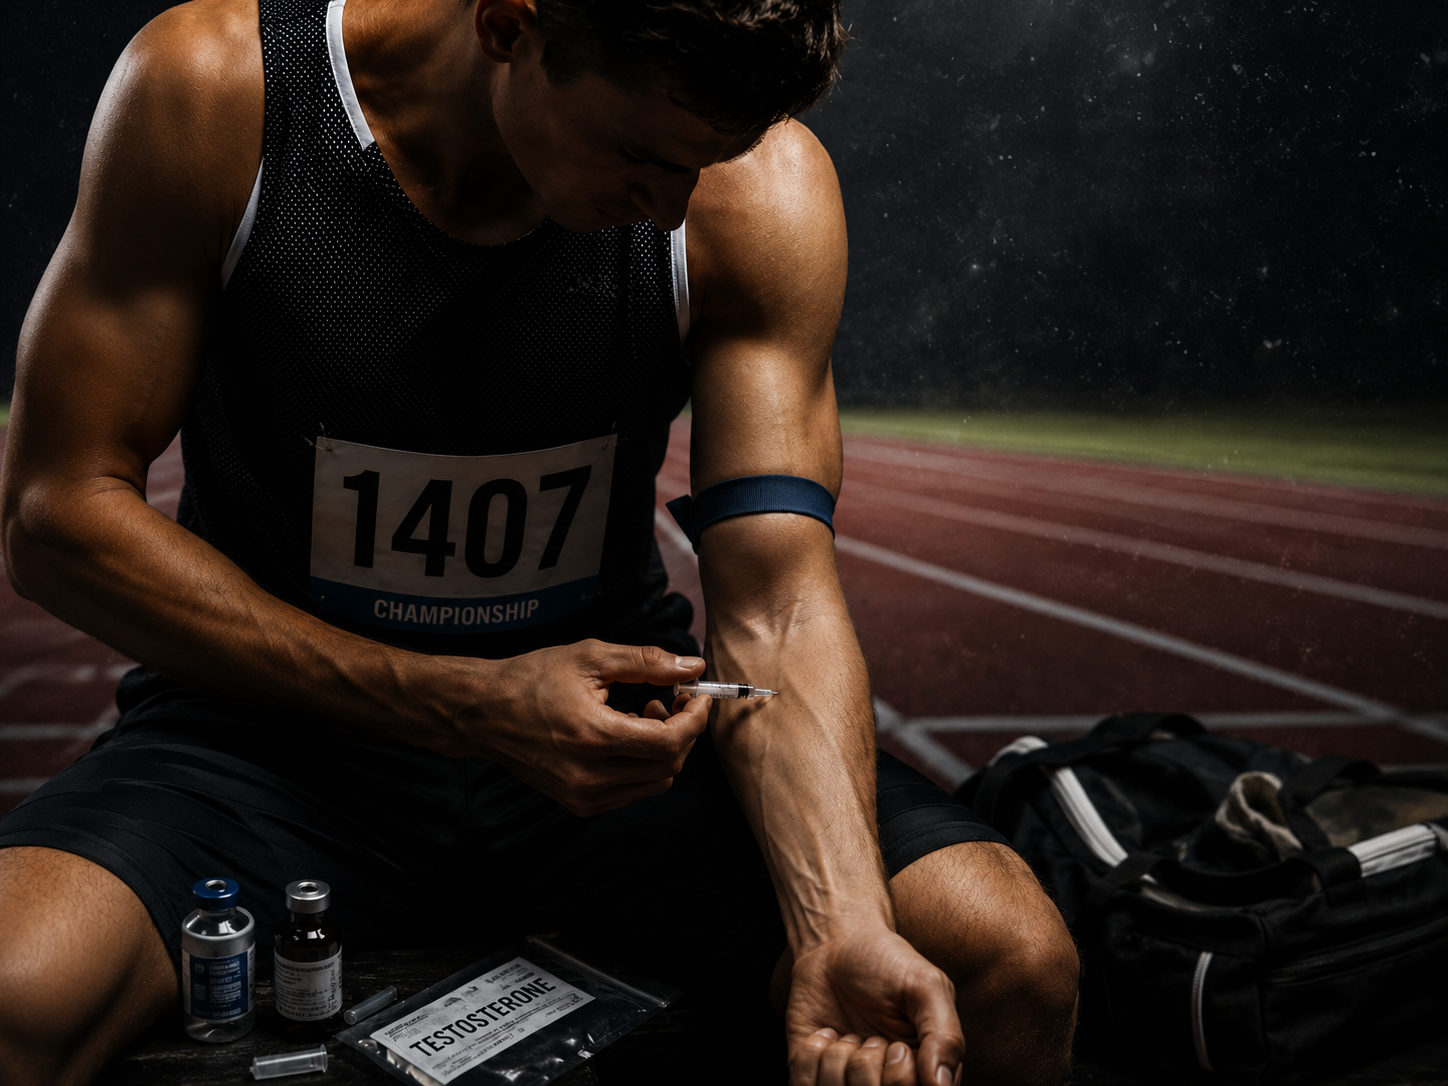
AI-generated image
We are pleased to present a detailed analysis of the impact of doping on athletics, using Google Looker Studio as the platform for this interactive report.
The tool is publicly available and free to access.
The underlying data have been collected from several sources: ADDB as antidoping database, the European Athletics website, and World Athletics. Additional sources have been consulted to complement the study.
We hope you find the content interesting.
OVERVIEW
Objective of the Analysis
The aim of this analysis is to provide a historical overview, from 2000 to 2025, of the impact of doping in sport, with a particular focus on athletics.
The analysis is divided into two parts. The first part, presented here, provides information on doping and its historical evolution by country, including data on doping substances, their classification and the sanctions imposed.
The second part, currently under development, will attempt to assess the impact of doping on athletic performance and results, should the available data indicate a significant effect.
Methodology
The report, created in Google Data Studio (Looker Studio), allows the data to be segmented by several parameters, including countries, type of substances, time period, gender, and so on. This makes it possible to perform different comparisons by applying the appropriate filters and analysing the data from the desired perspective.
The report contains three pages, which can be accessed by clicking the titles in the top navigation bar.
Although the layout adapts to the viewing interface, we recommend using a computer or, at least, a tablet for the best viewing experience.
PAGE I : Doping by Sports
On the first page, we compare doping cases across sports during the period analysed (2000–2025), in order to assess the relative impact across different sports. As we will see, Athletics ranks third, an unfortunate position, surpassed only by Weightlifting and Cycling.
Data Selection Controls
At the top of the report, you will find dropdown controls, in this page only “Sport” selection is included, so the information displayed in all subsequent tables and charts will be affected in case of filtering
The drop-downs allow you to select one, several or all available options intuitively. The report automatically updates to reflect the selected data.
You can also filter the information by clicking directly on data points in most of the charts and tables throughout the report.
Top 15 Sports with the highest number of Doping Cases (2000–2025)
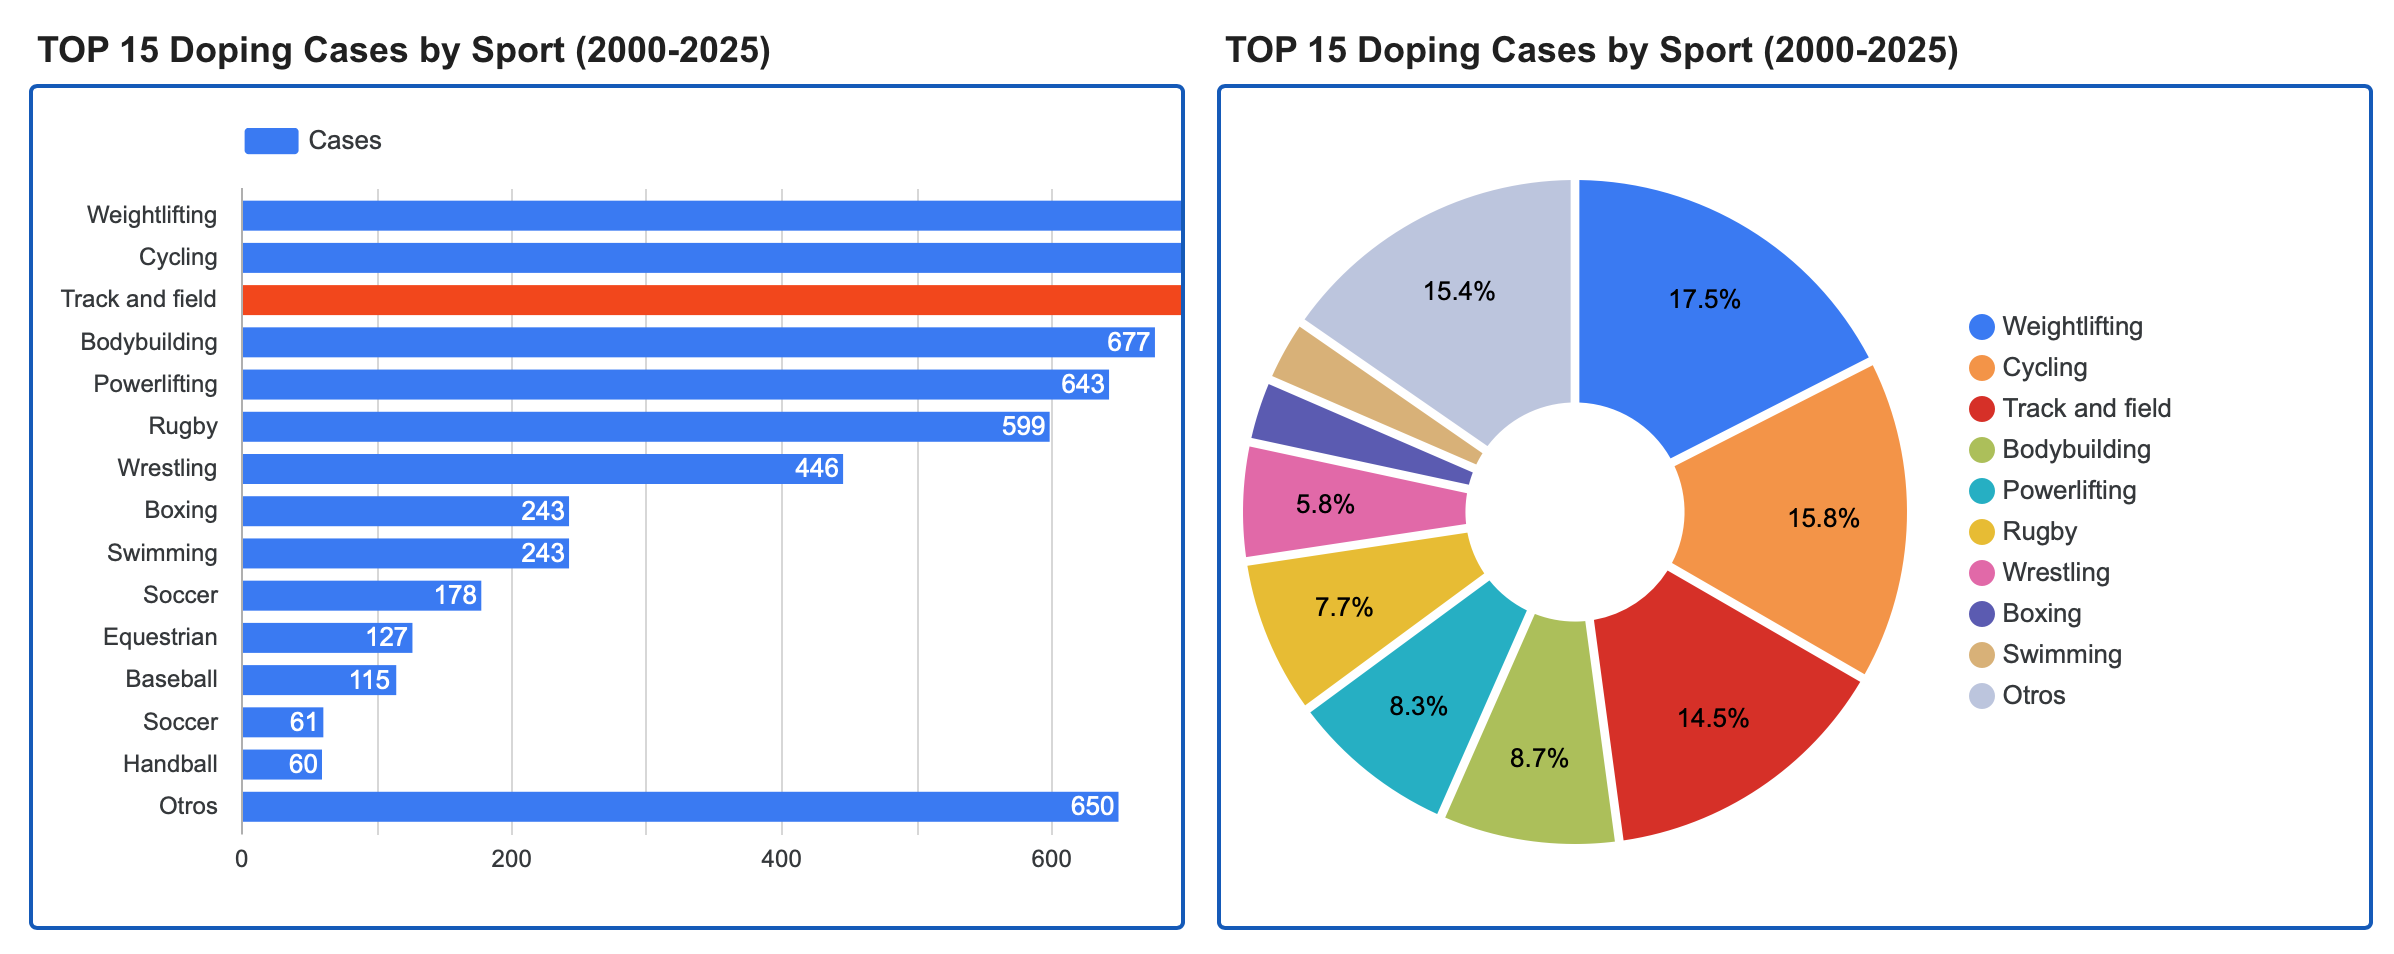
The bar chart shows the 15 sports with the highest number of doping cases, while the following pie chart shows each sport’s percentage share of the total.
The data displayed are affected by the selections made above. This allows you to compare two or more selected sports, perhaps not included in the TOP 15
Top 5 Sports: Doping Cases Evolution (2000–2025)
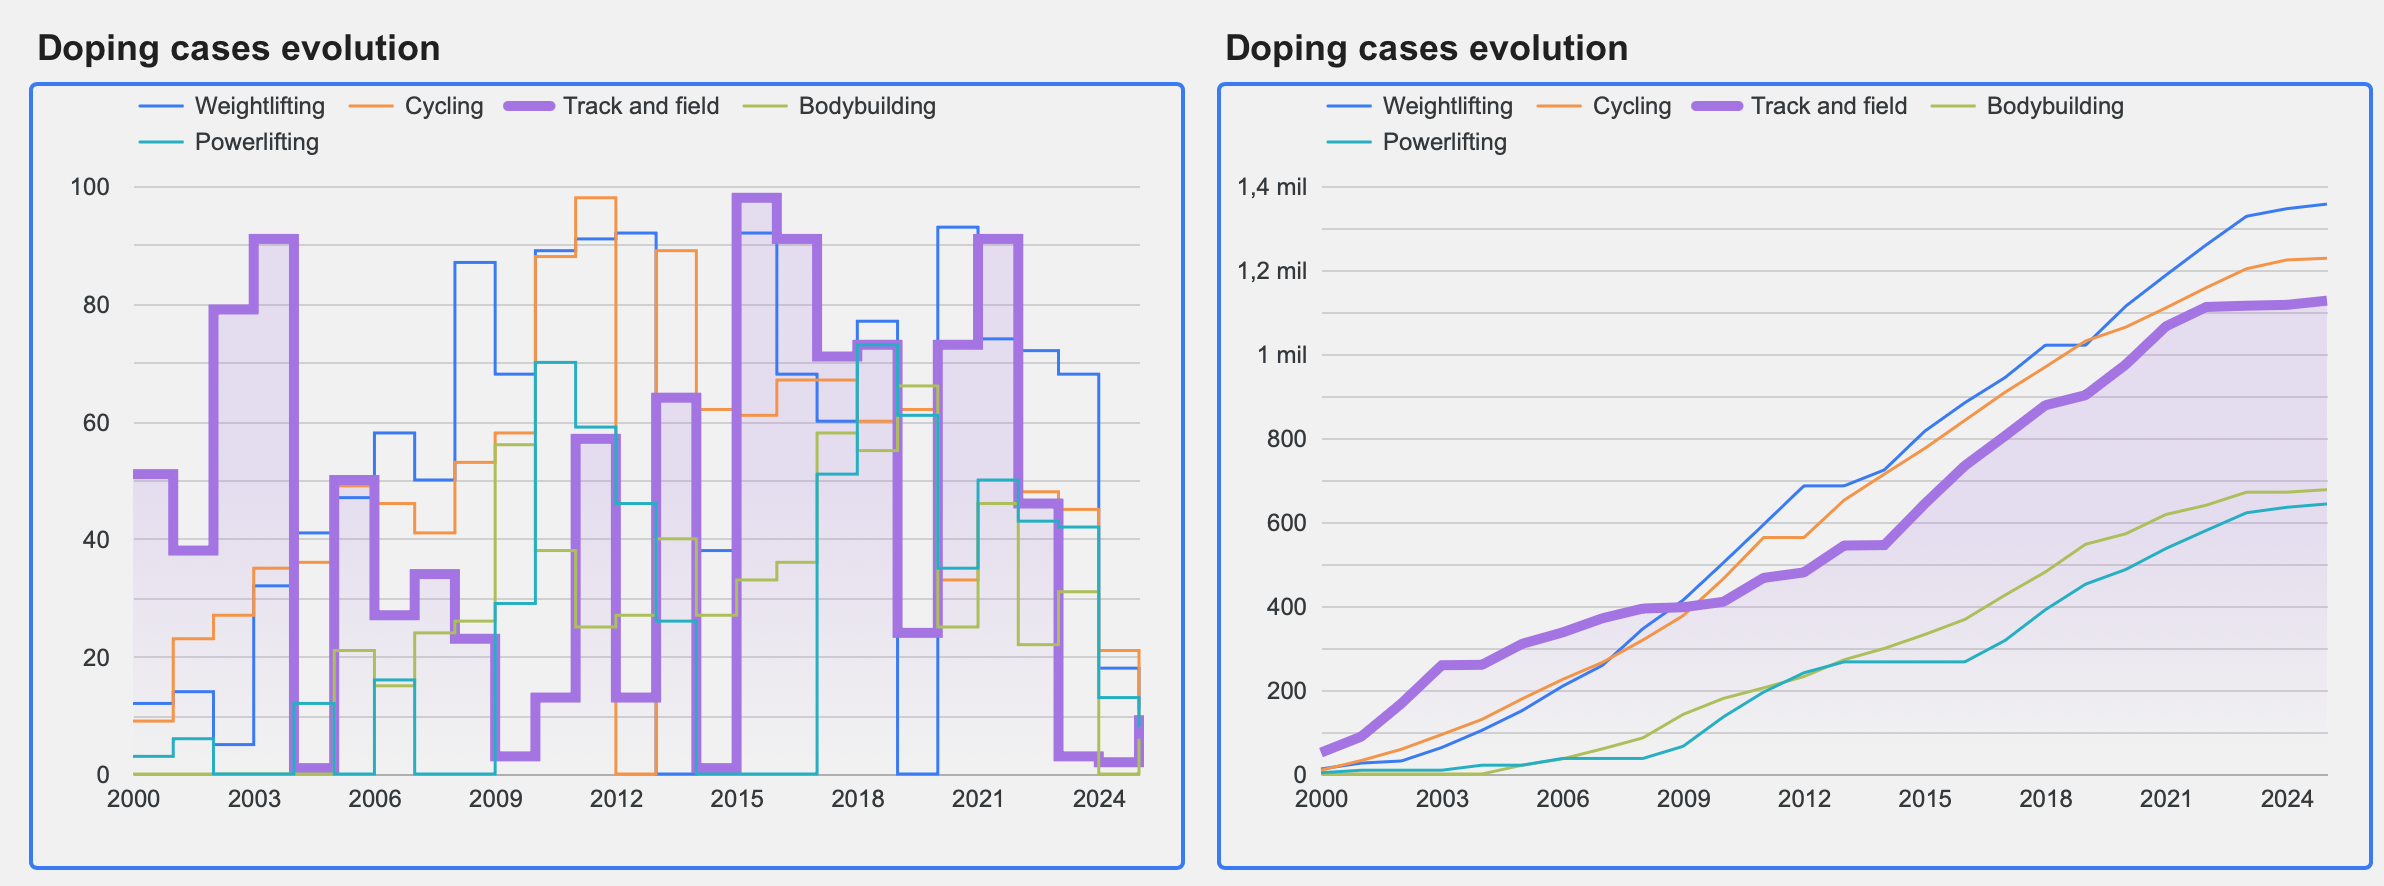
The first chart shows the evolution over time of doping cases in the five sports with the highest number of cases. The second chart shows the same data as a cumulative total over time.
The data displayed are affected by the selections made above. This allows you to compare two or more selected sports, perhaps not included in the TOP 5
(Athletics is highlighted with a purple line)
Complete Table of Doping Cases by Year and Sport (2000–2025)
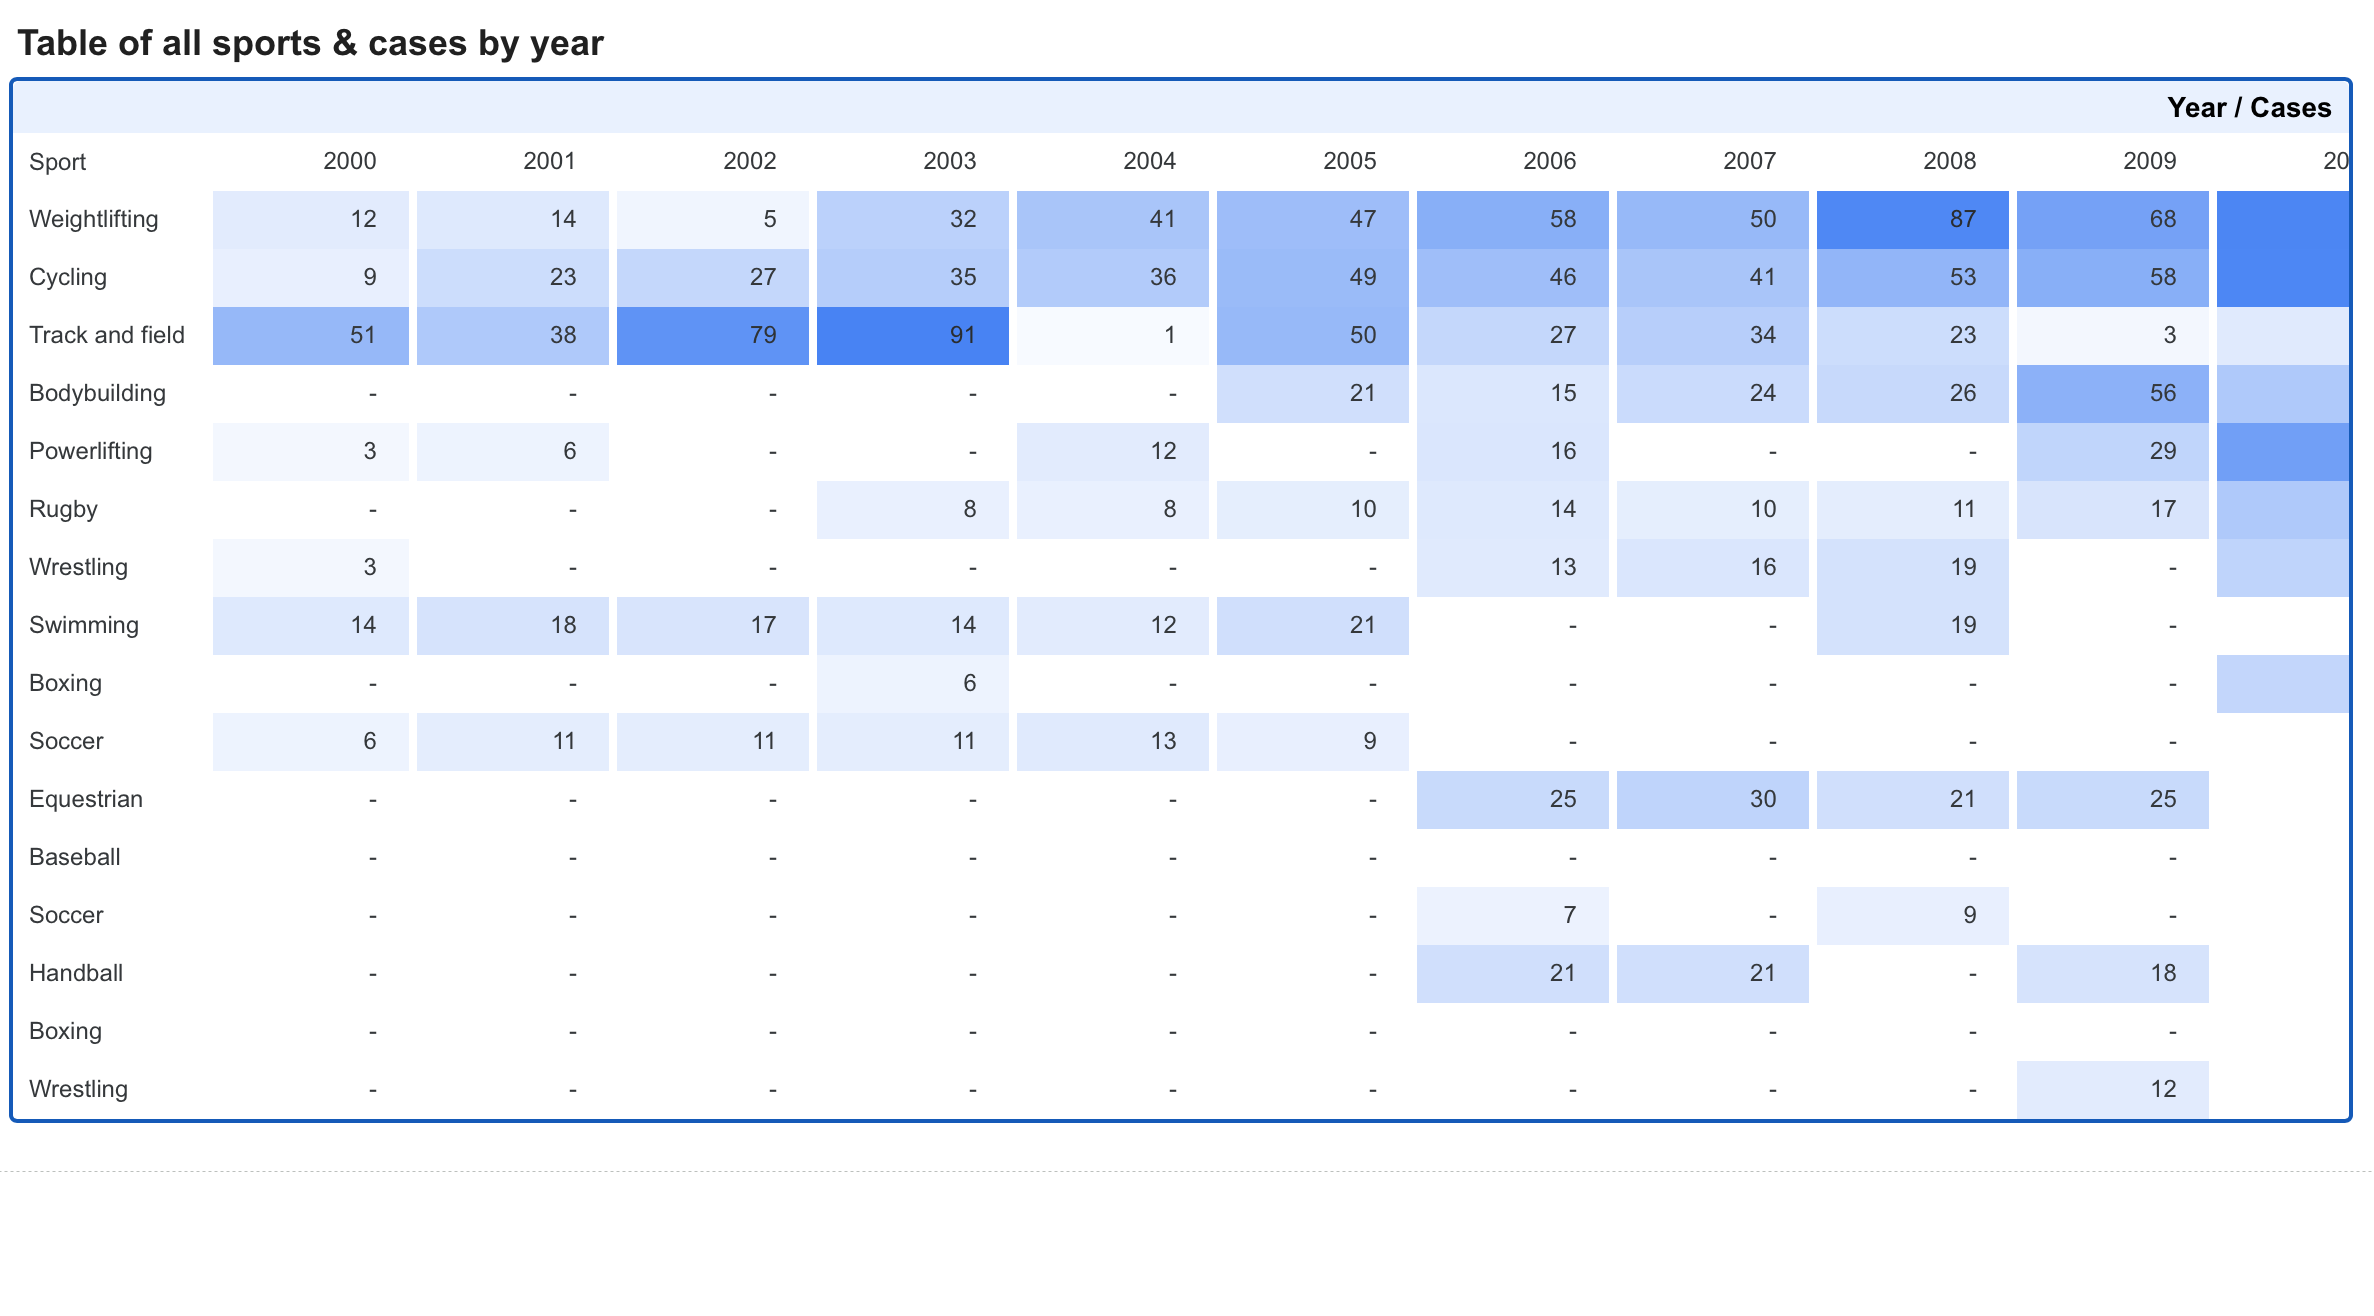
The table shows the number of doping cases by sport, with the years displayed as columns, providing a complete overview of the available data.
The data displayed are affected by the selections made above.
PAGE II : TRACK & FIELD DOPING
On the second page, we focus on doping cases in Athletics, examining their historical evolution by country and type of substance, together with the complete table of athletes sanctioned during the period analyzed.
Data Selection Controls
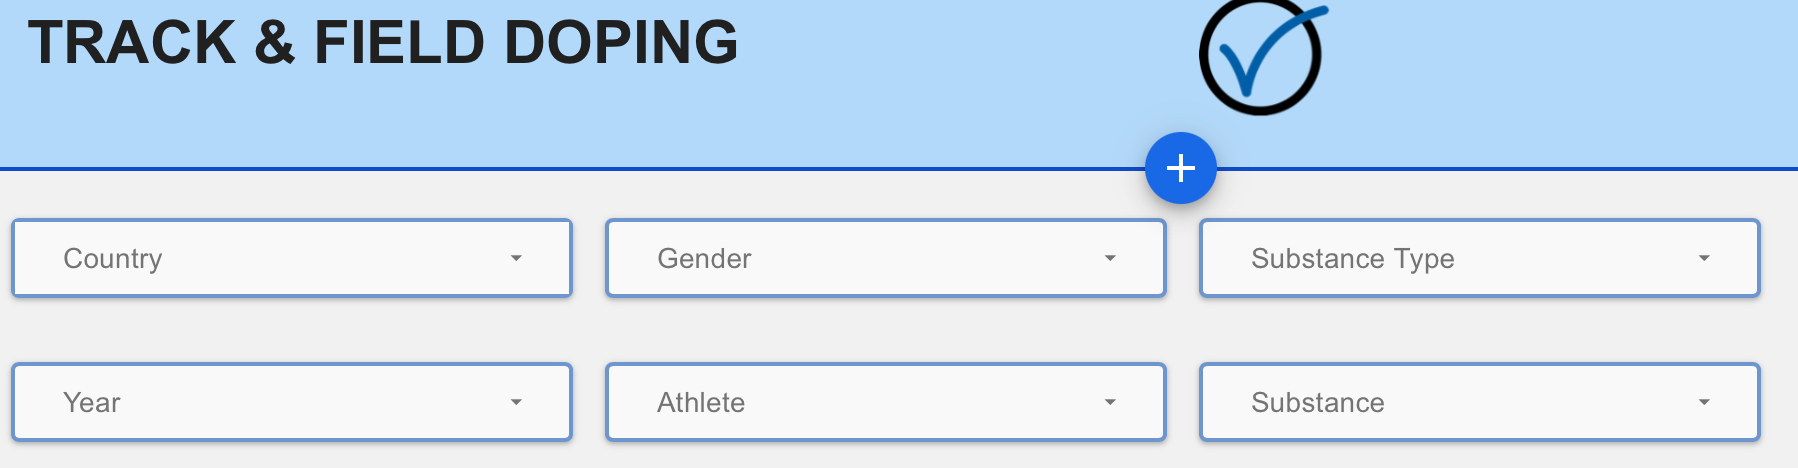
The drop-downs allow you to select one, several or all available options intuitively. The report automatically updates to reflect the selected data.
You can also filter the information by clicking directly on data points in most of the charts and tables throughout the report.
Evolution of Doping Cases (2000–2025)
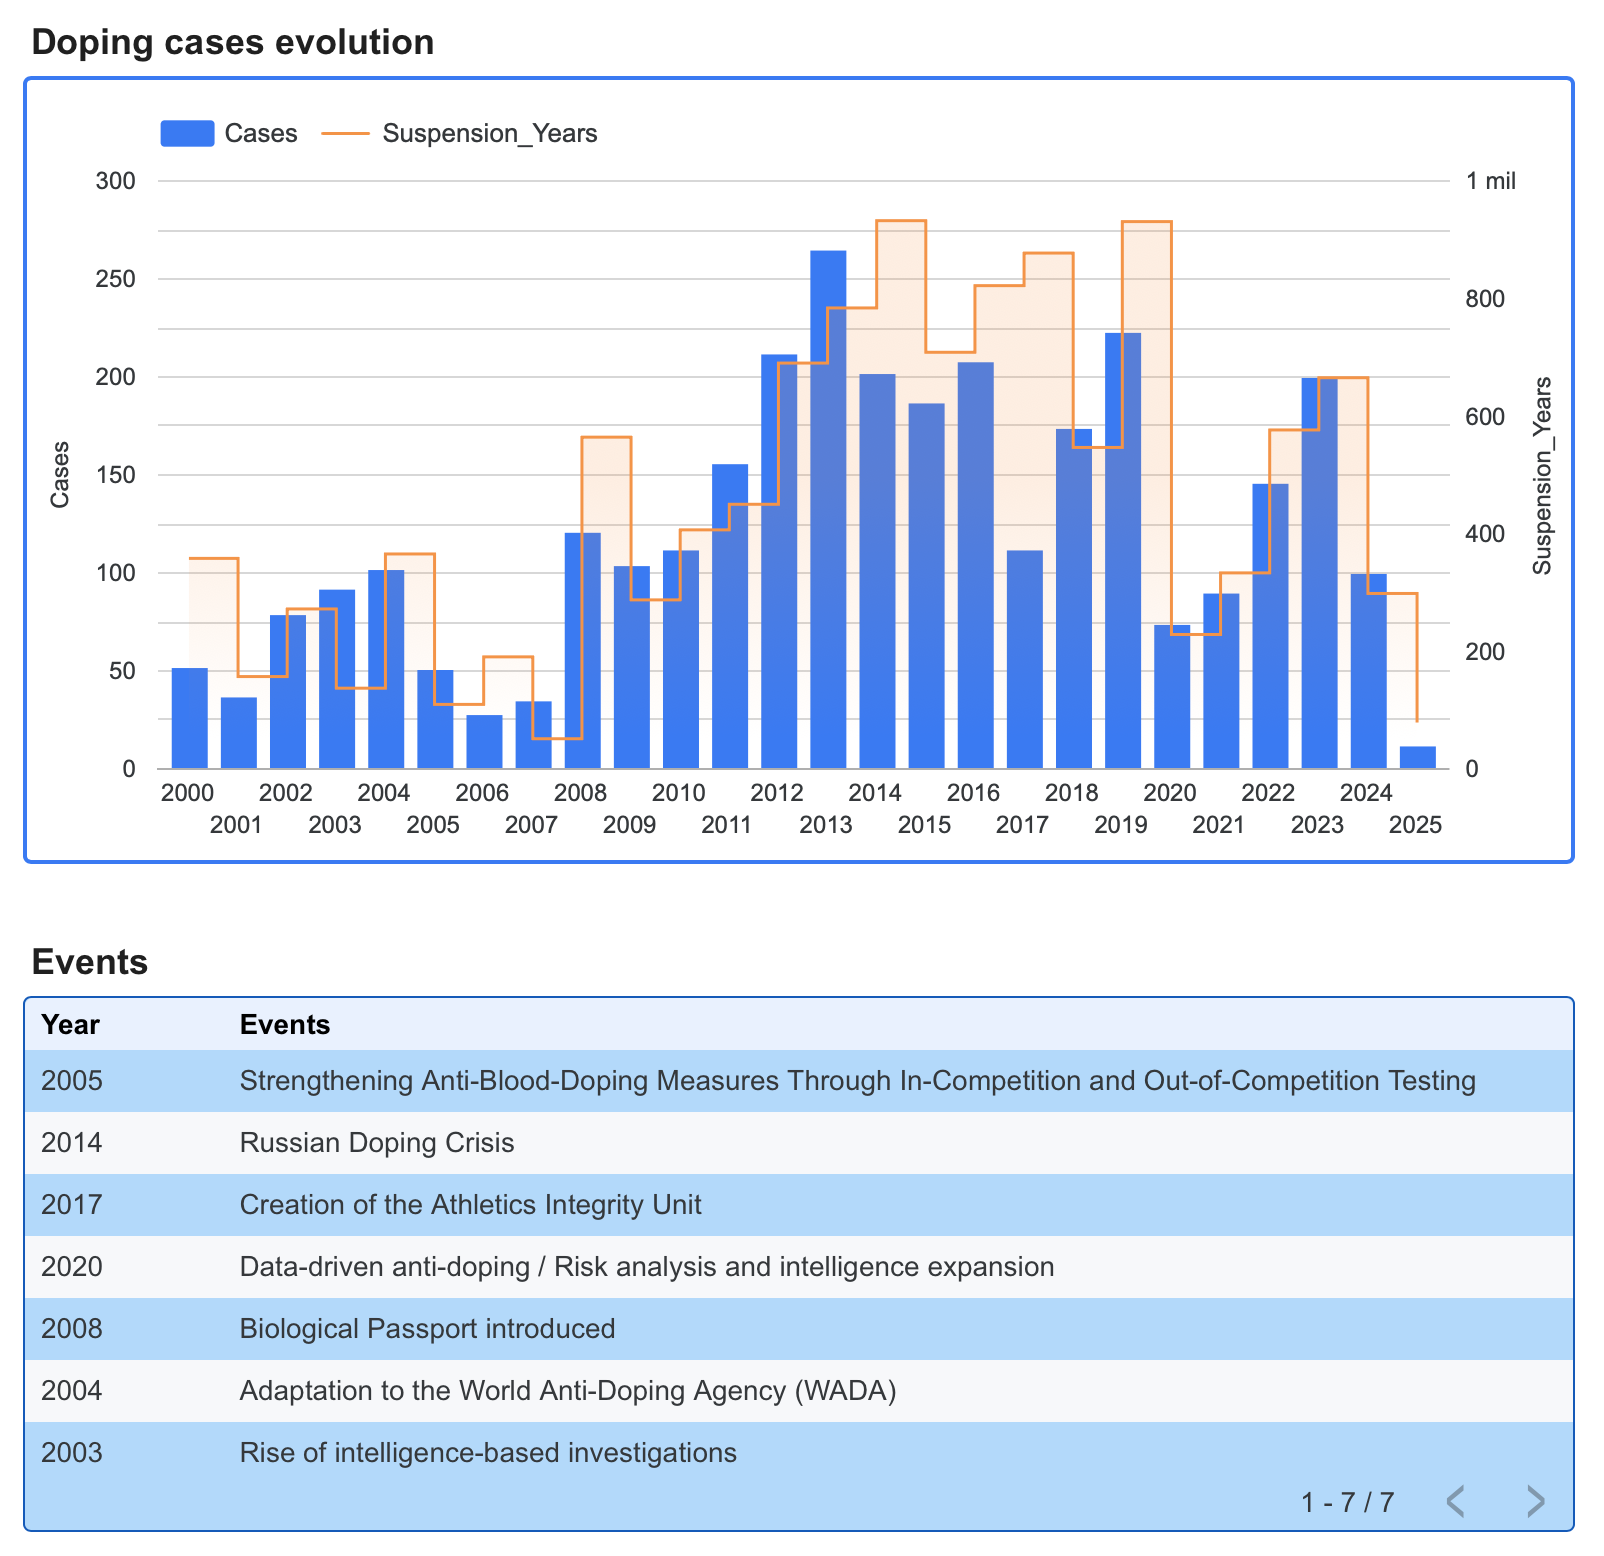
The chart shows the time series of doping cases (bars) alongside the cumulative number of suspension years resulting from the sanctions.
The table below shows the main actions taken by World Athletics in the fight against doping.
Please remember that you can filter these data using the dropdown controls above or by clicking on any of the charts.
Cases Map
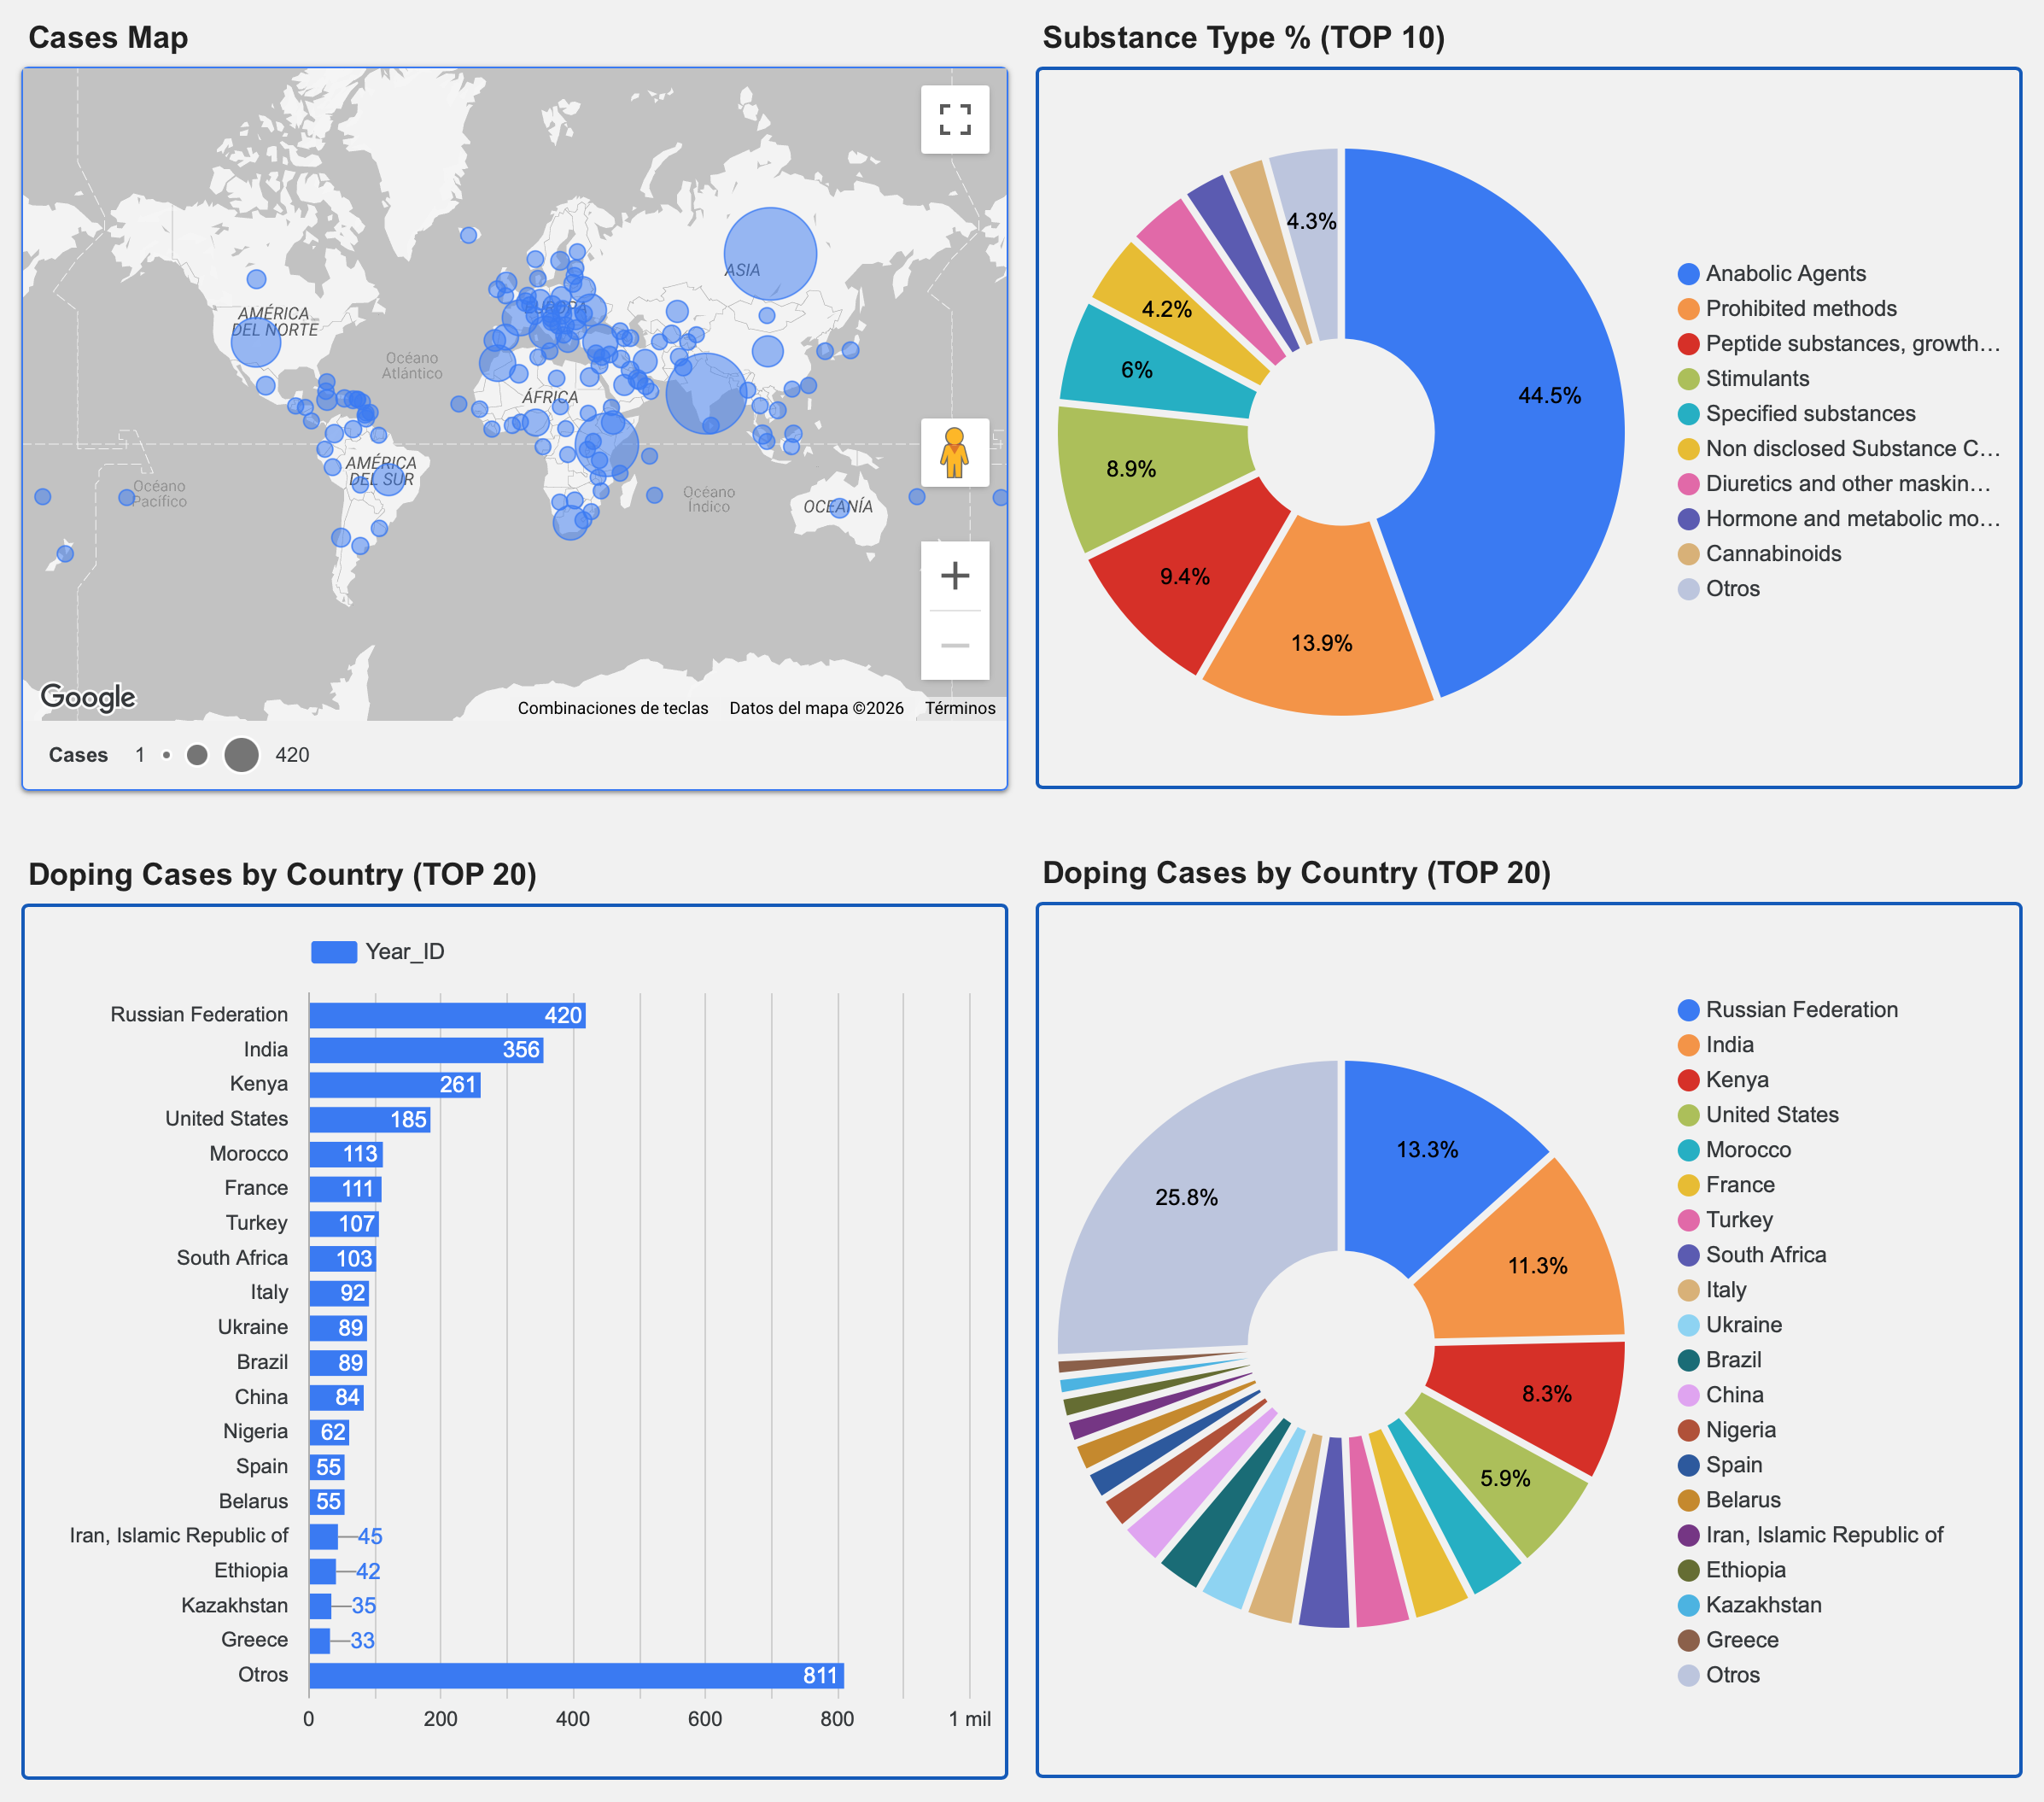
The map shows doping cases by country, with bubble size proportional to the number of cases. The first pie chart shows the percentage breakdown by type of doping substance (Top 10).
Below, a bar chart shows the number of cases by country, together with a pie chart showing the percentage share by country. In both cases, only the Top 20 are displayed.
Please remember that you can filter these data using the dropdown controls above or by clicking on any of the charts.
Table of athletes
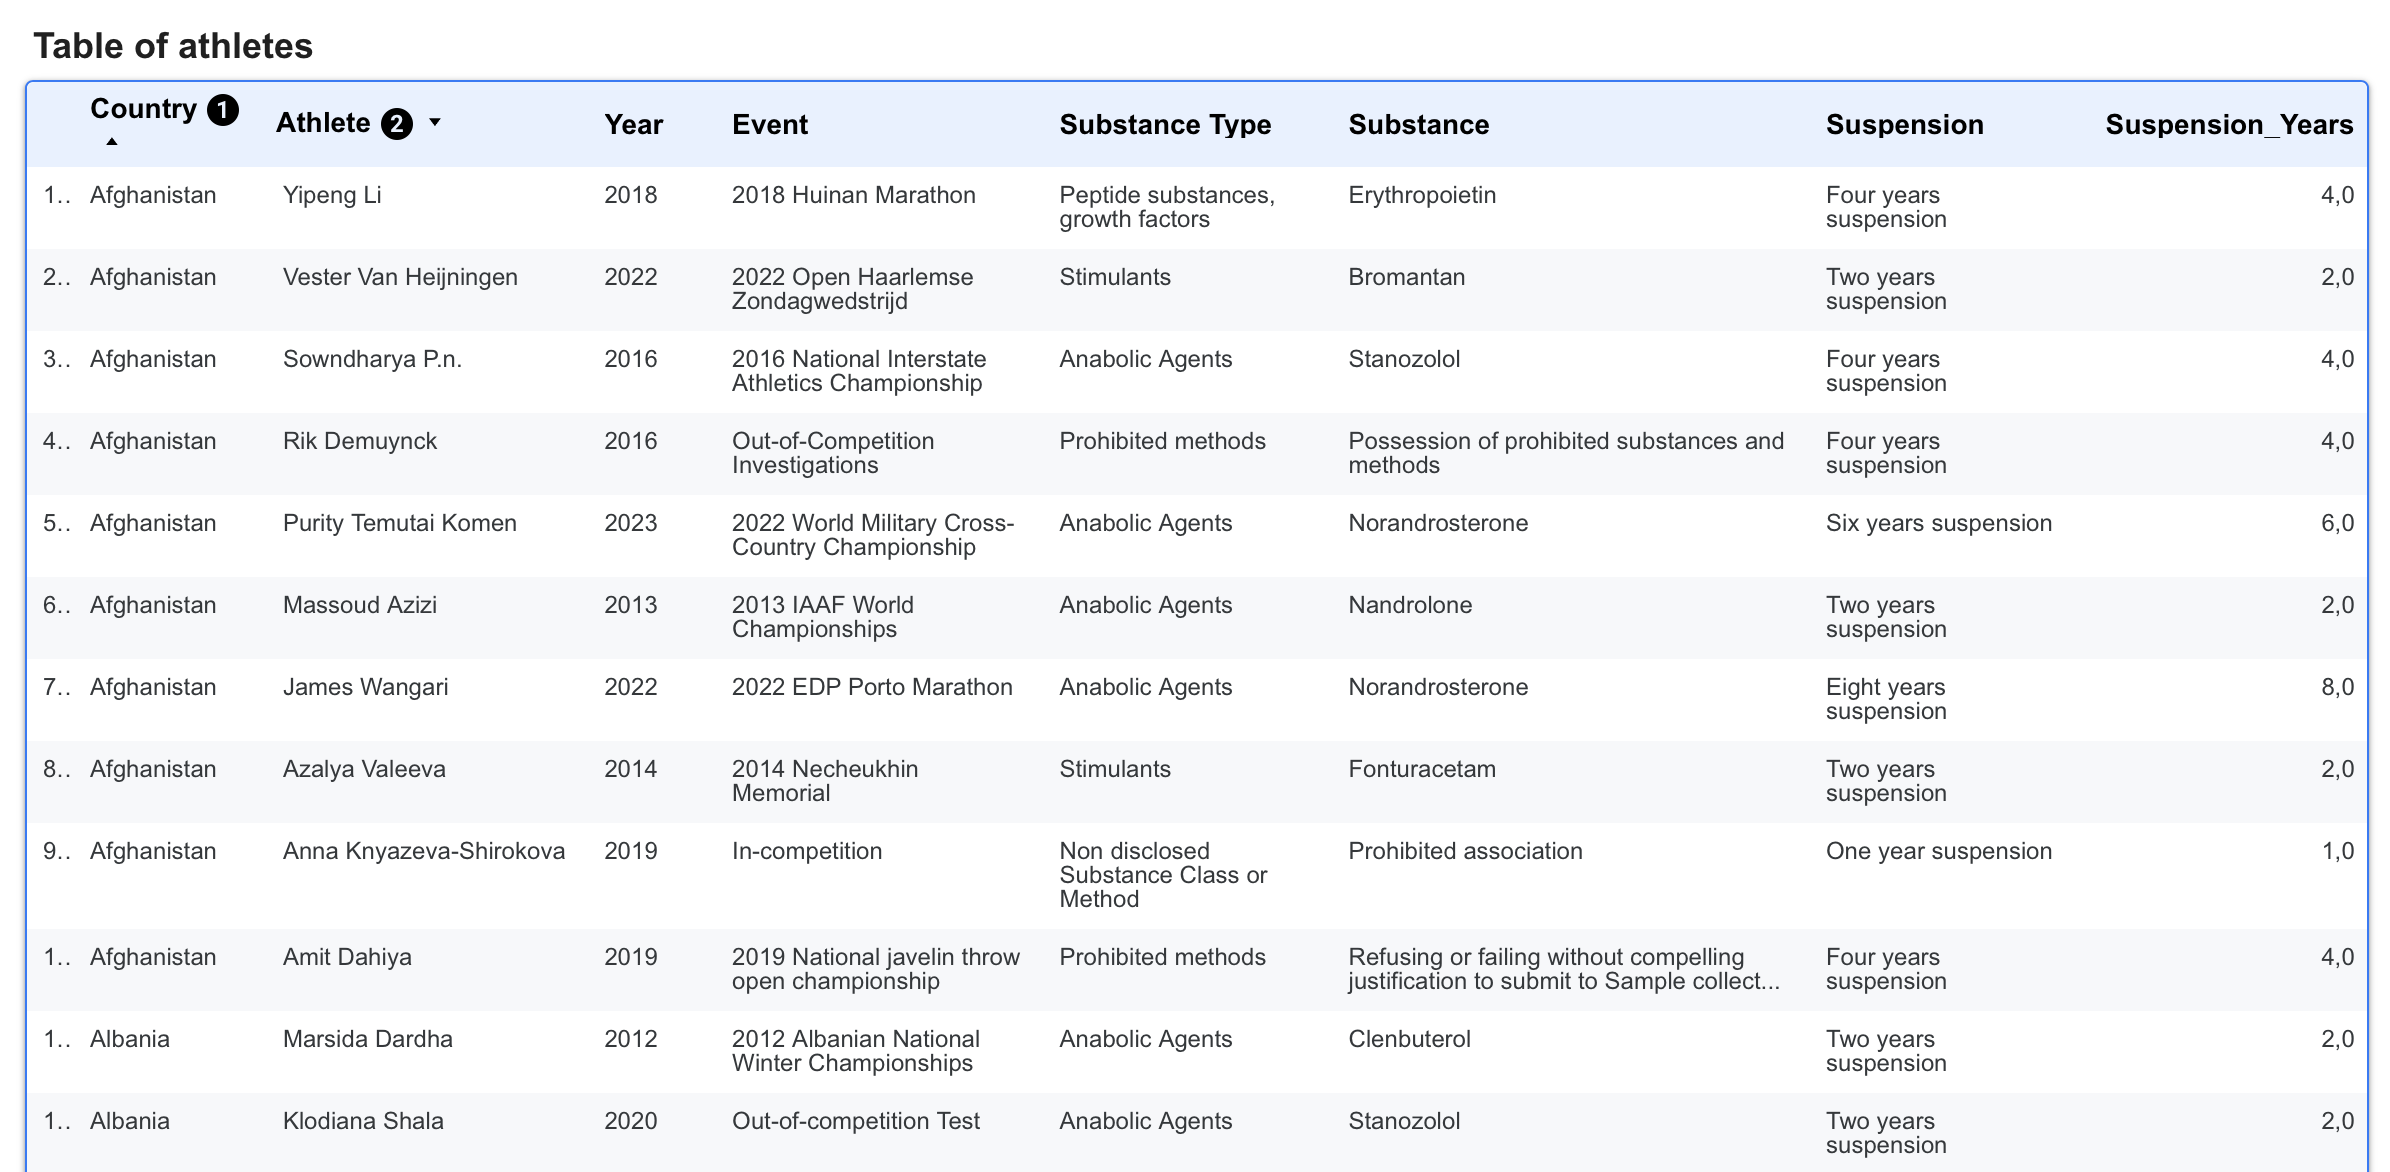
Finally, we present the complete table of sanctioned athletes, including their country, year, event in which the sanction occurred, type of substance, substance involved, and the resulting suspension, shown both as a value and in years.
Please remember that you can filter these data using the dropdown controls above or by clicking on any of the charts.
PAGE III: DOPING SUBSTANCES / METHODS
The third page analyses the different types of doping substances, their incidence and evolution over time, together with a brief description of their uses and effects.
Data Selection Controls
The drop-downs allow you to select one, several or all available options intuitively. The report automatically updates to reflect the selected data.
You can also filter the information by clicking directly on data points in most of the charts and tables throughout the report.
Doping Substances: Description, Events incidence and cases
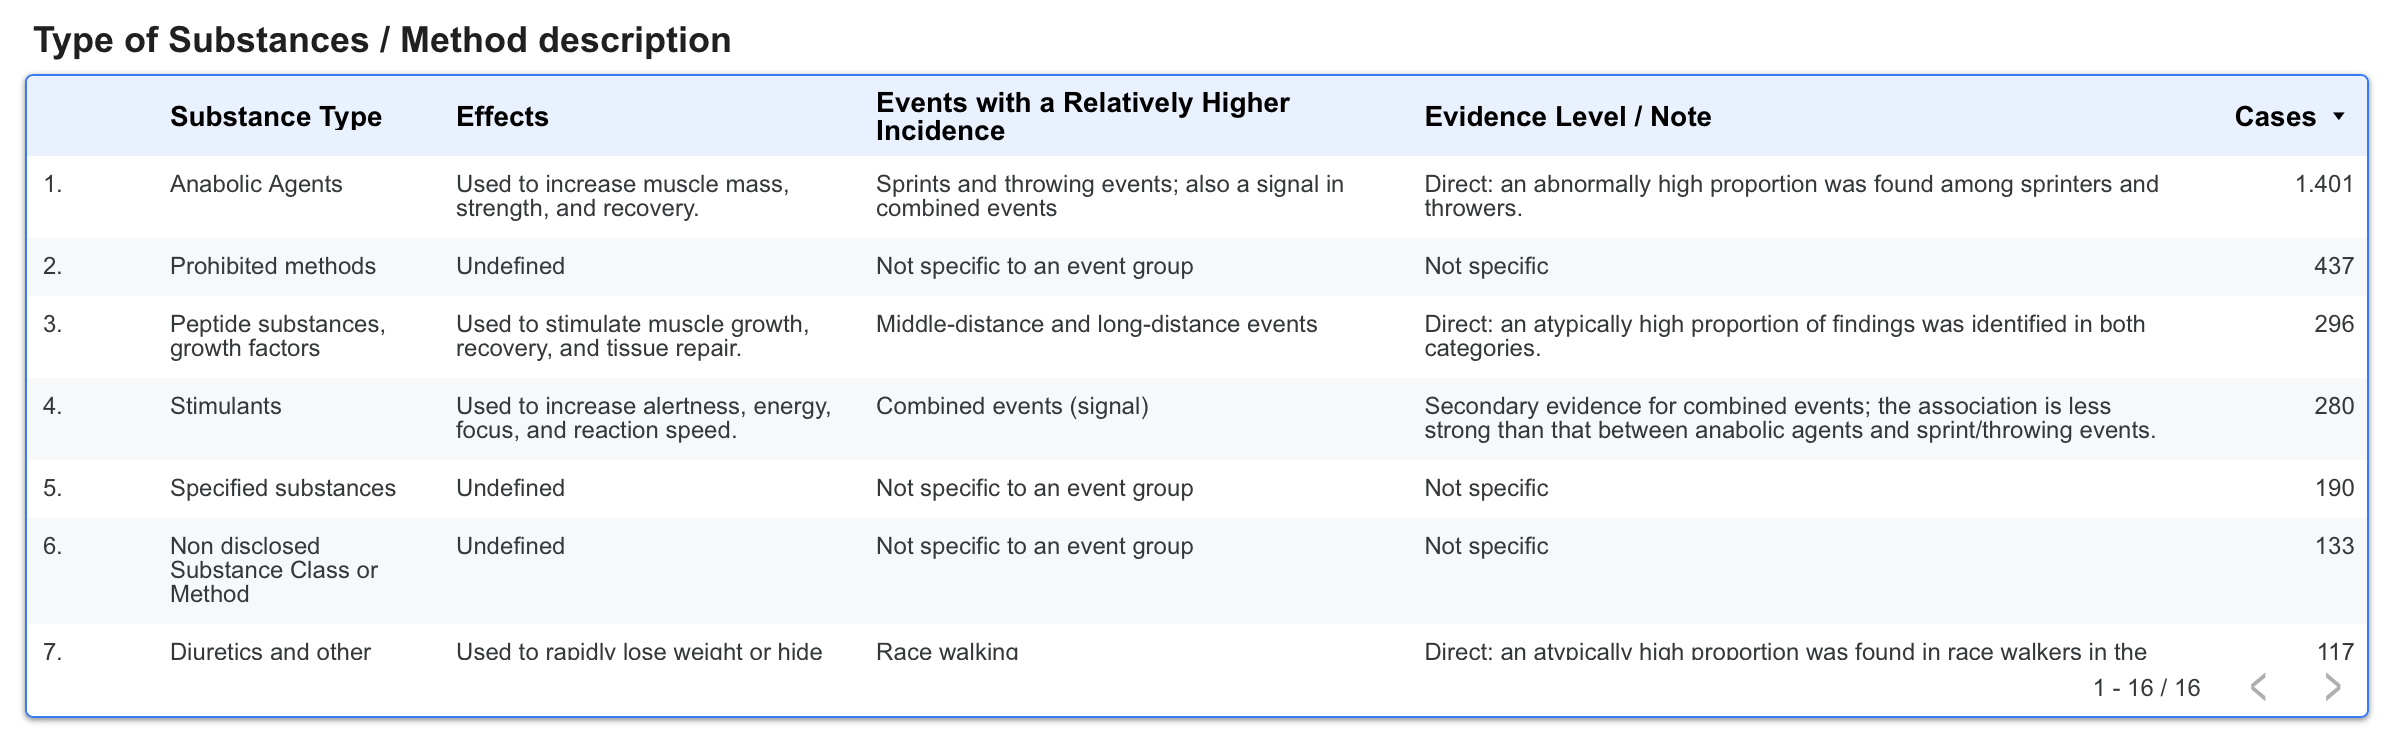
The following table shows the different types of doping substances, their effects and, in some cases, the event group where their incidence is higher, including the number of cases recorded over the historical period.
Please remember that you can filter these data using the dropdown controls above or by clicking on any of the charts.
Doping Substances: Evolution by type of substance
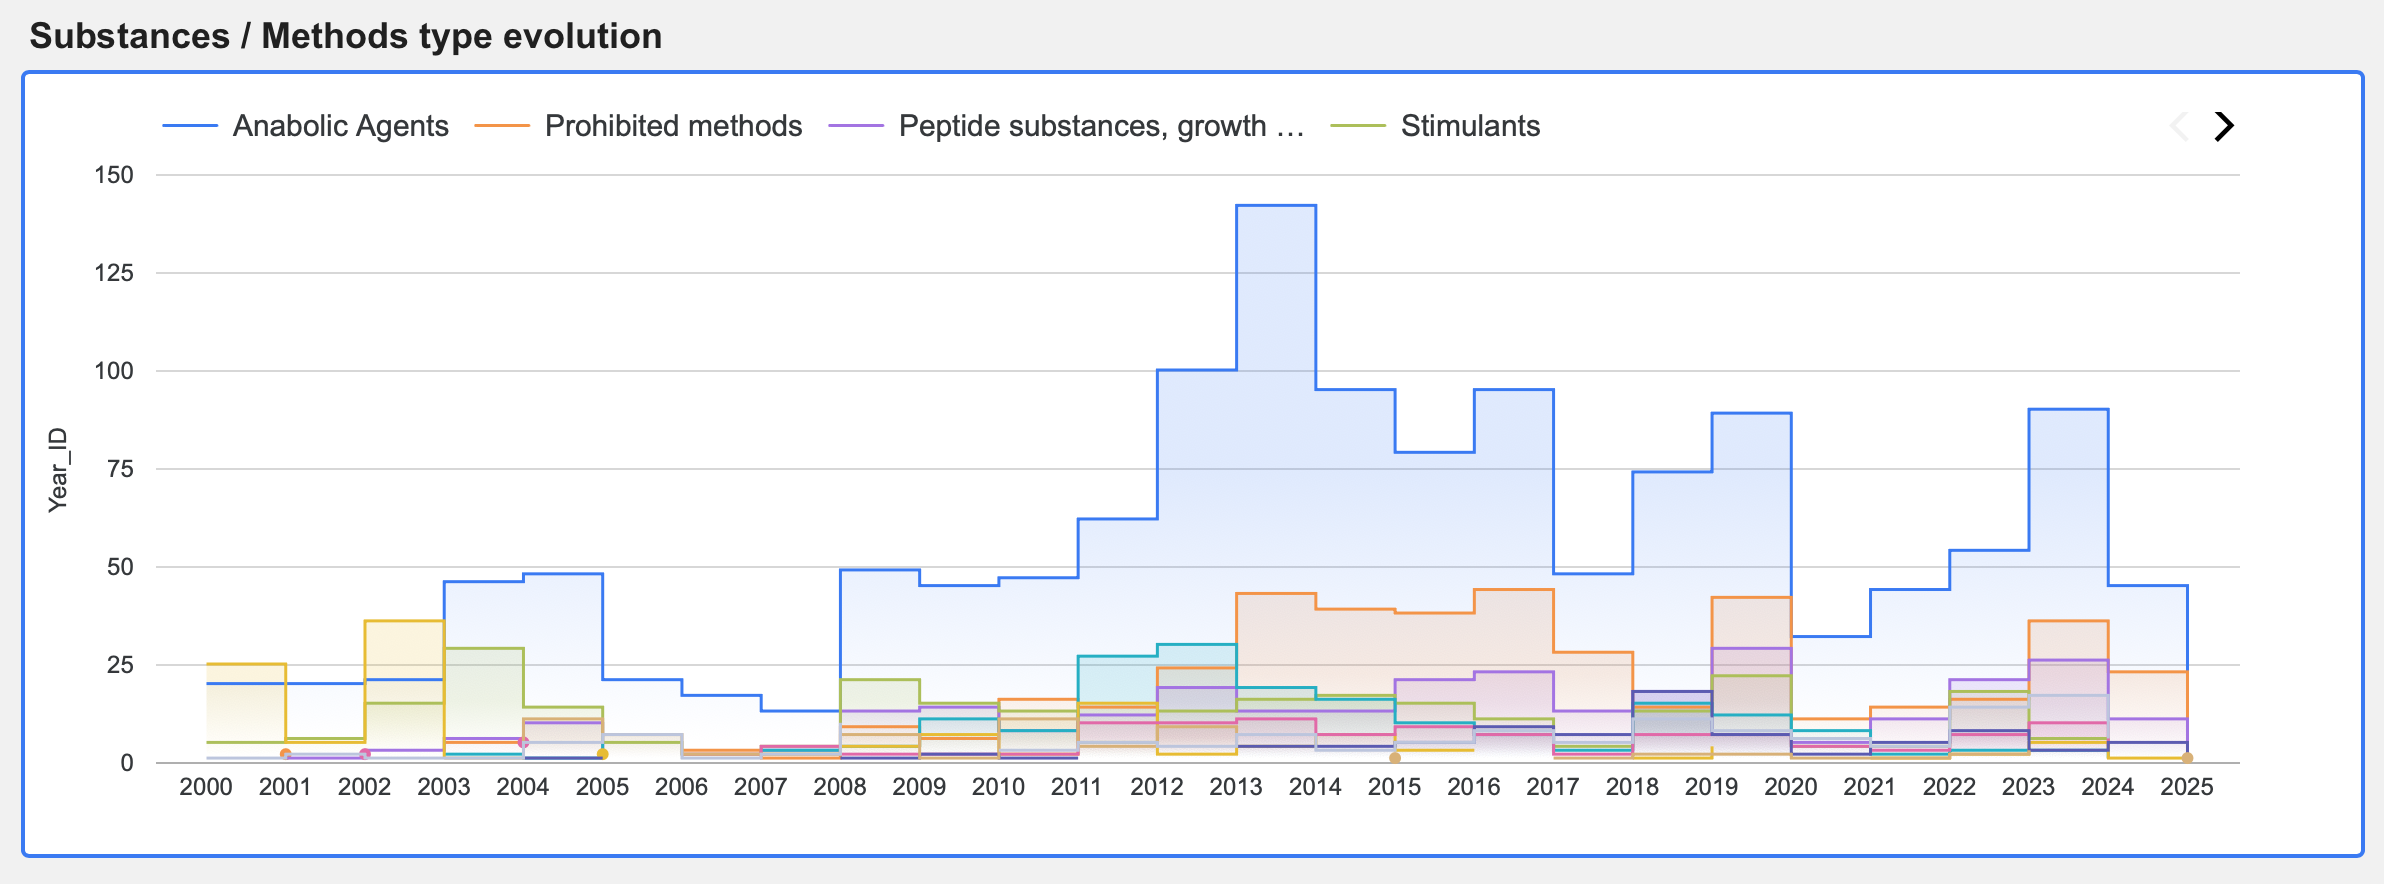
The chart shows the evolution over time of doping cases by substance type (Top 10). Hovering over the chart displays labels with the number of cases for each year.
Please remember that you can filter these data using the dropdown controls above or by clicking on any of the charts.
Map of doping type of substances
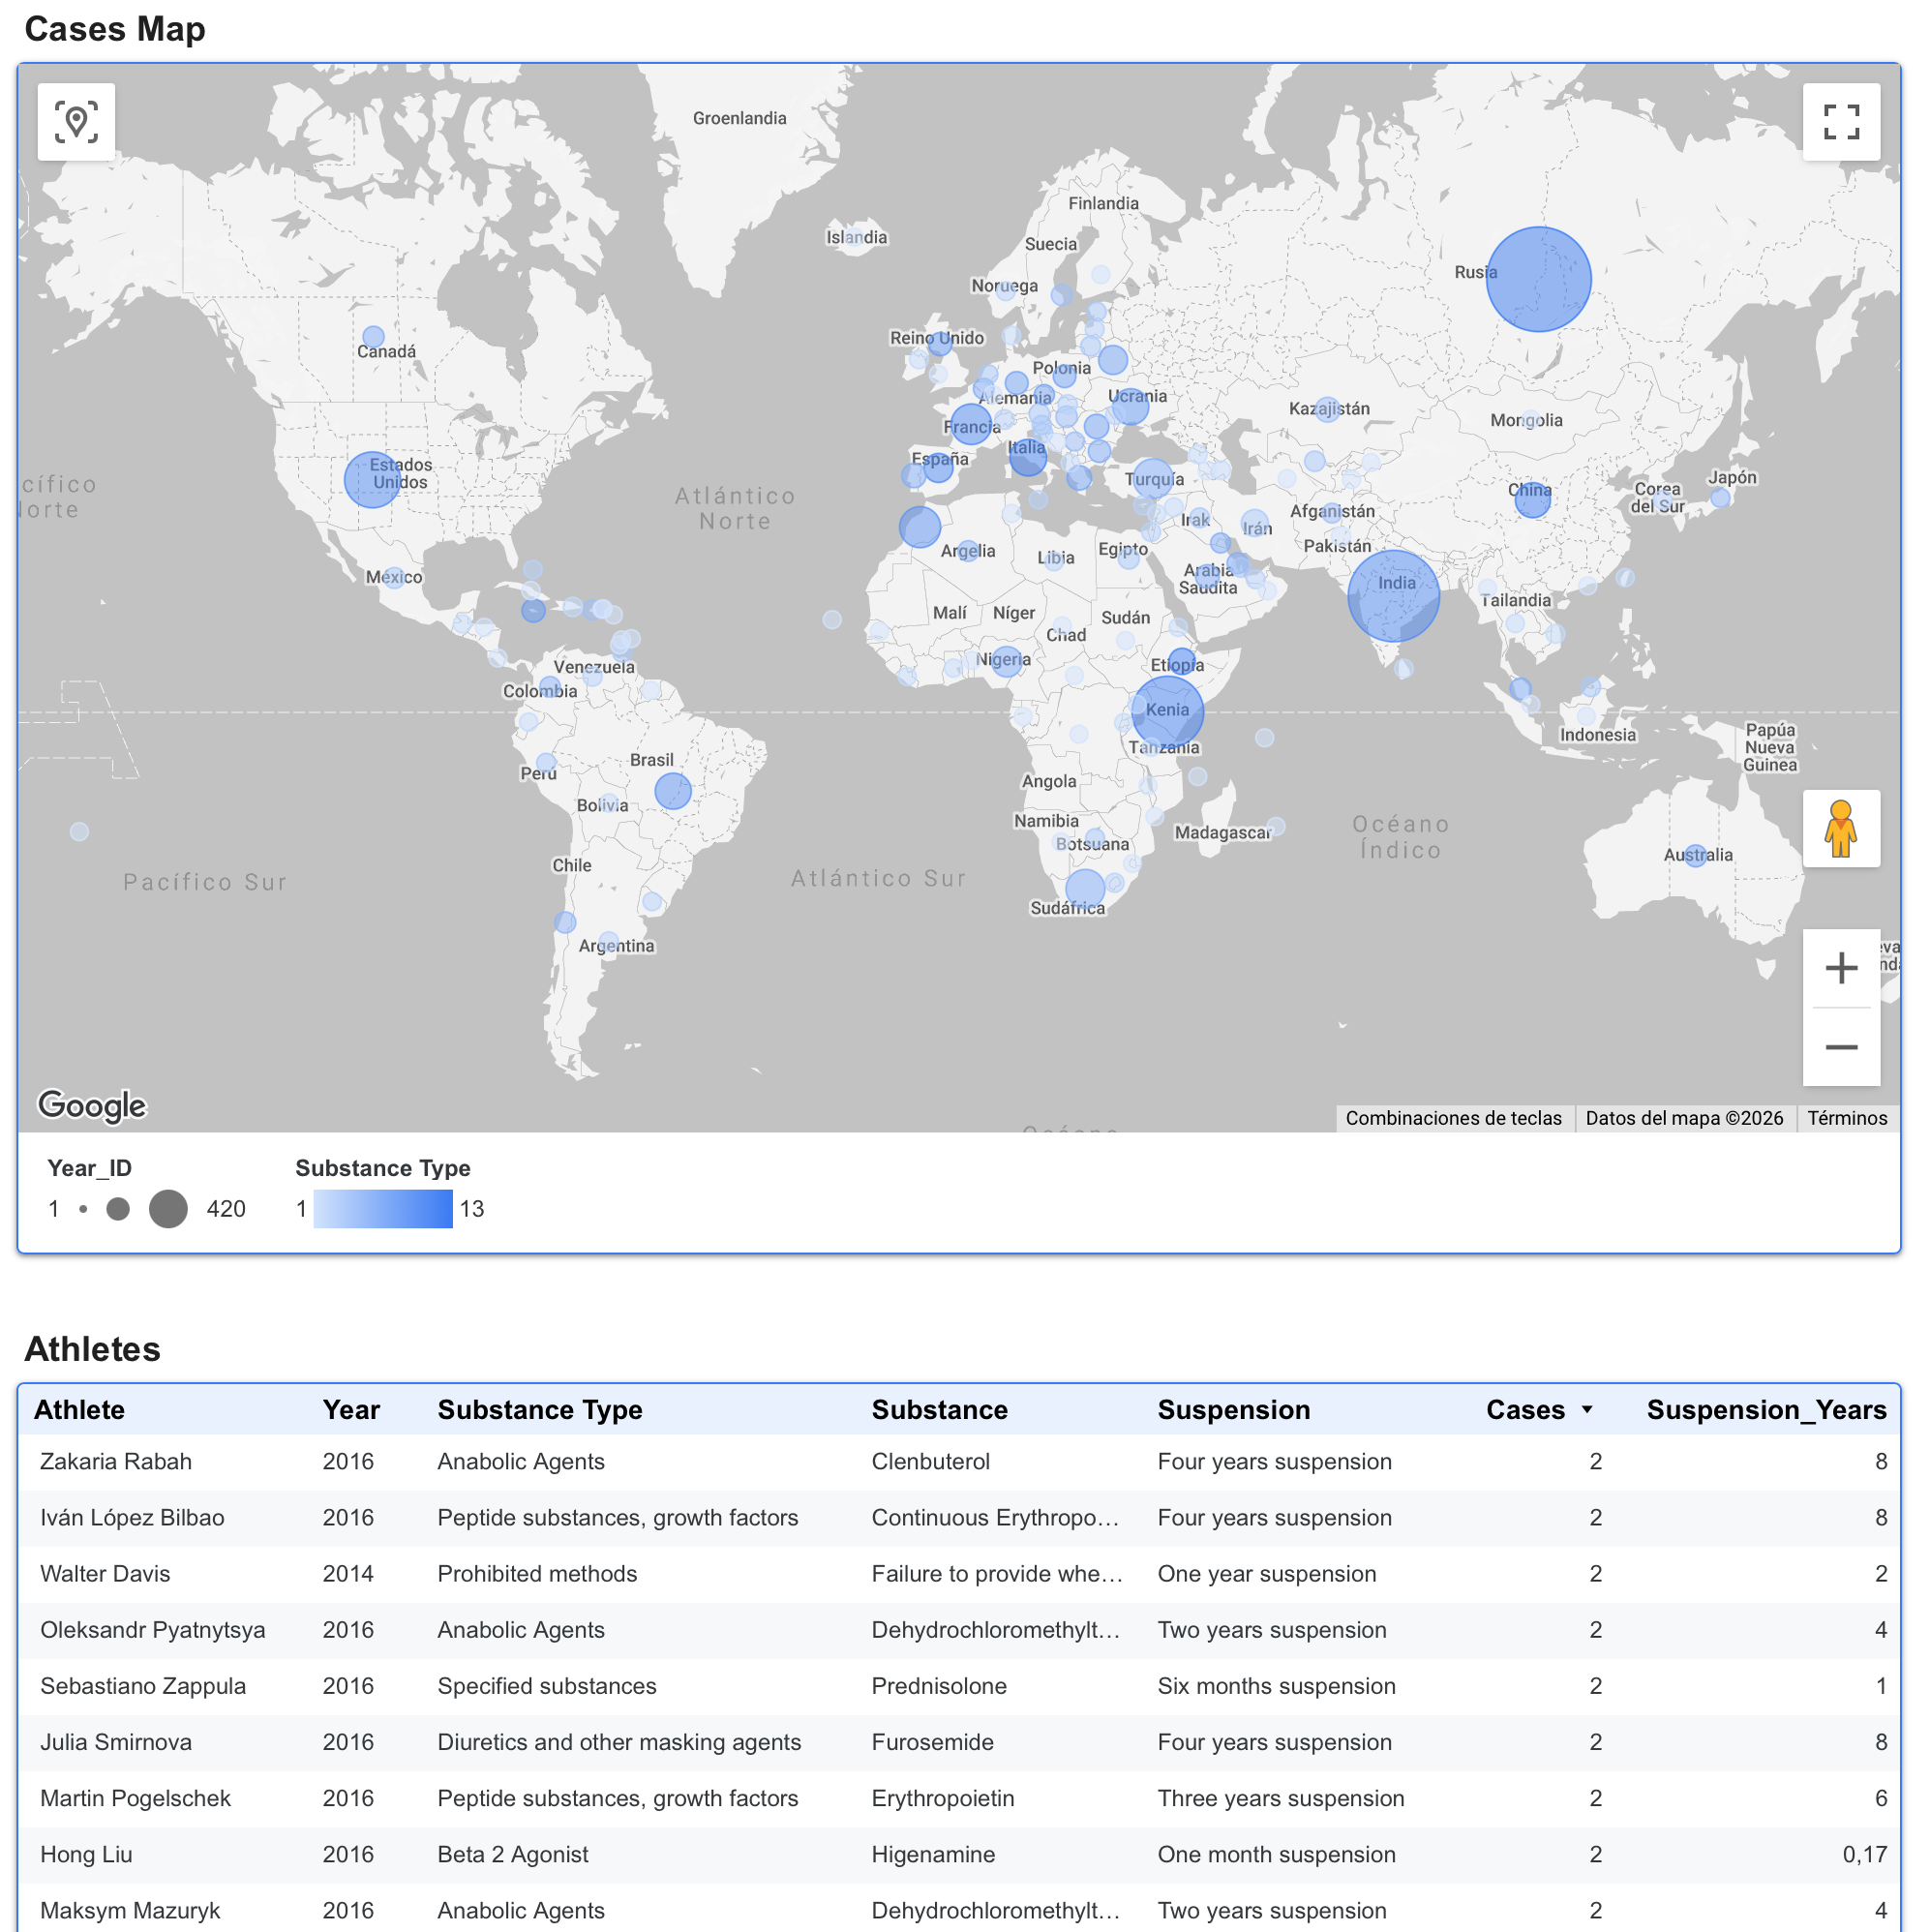
The map shows the countries with recorded doping cases. The size of each bubble represents the number of cases, while the intensity of its colour indicates the number of different substances involved. You can select a country to view further details in the following charts.
The table below shows the athletes involved.
Please remember that you can filter these data using the dropdown controls above or by clicking on any of the charts.
Doping substance details
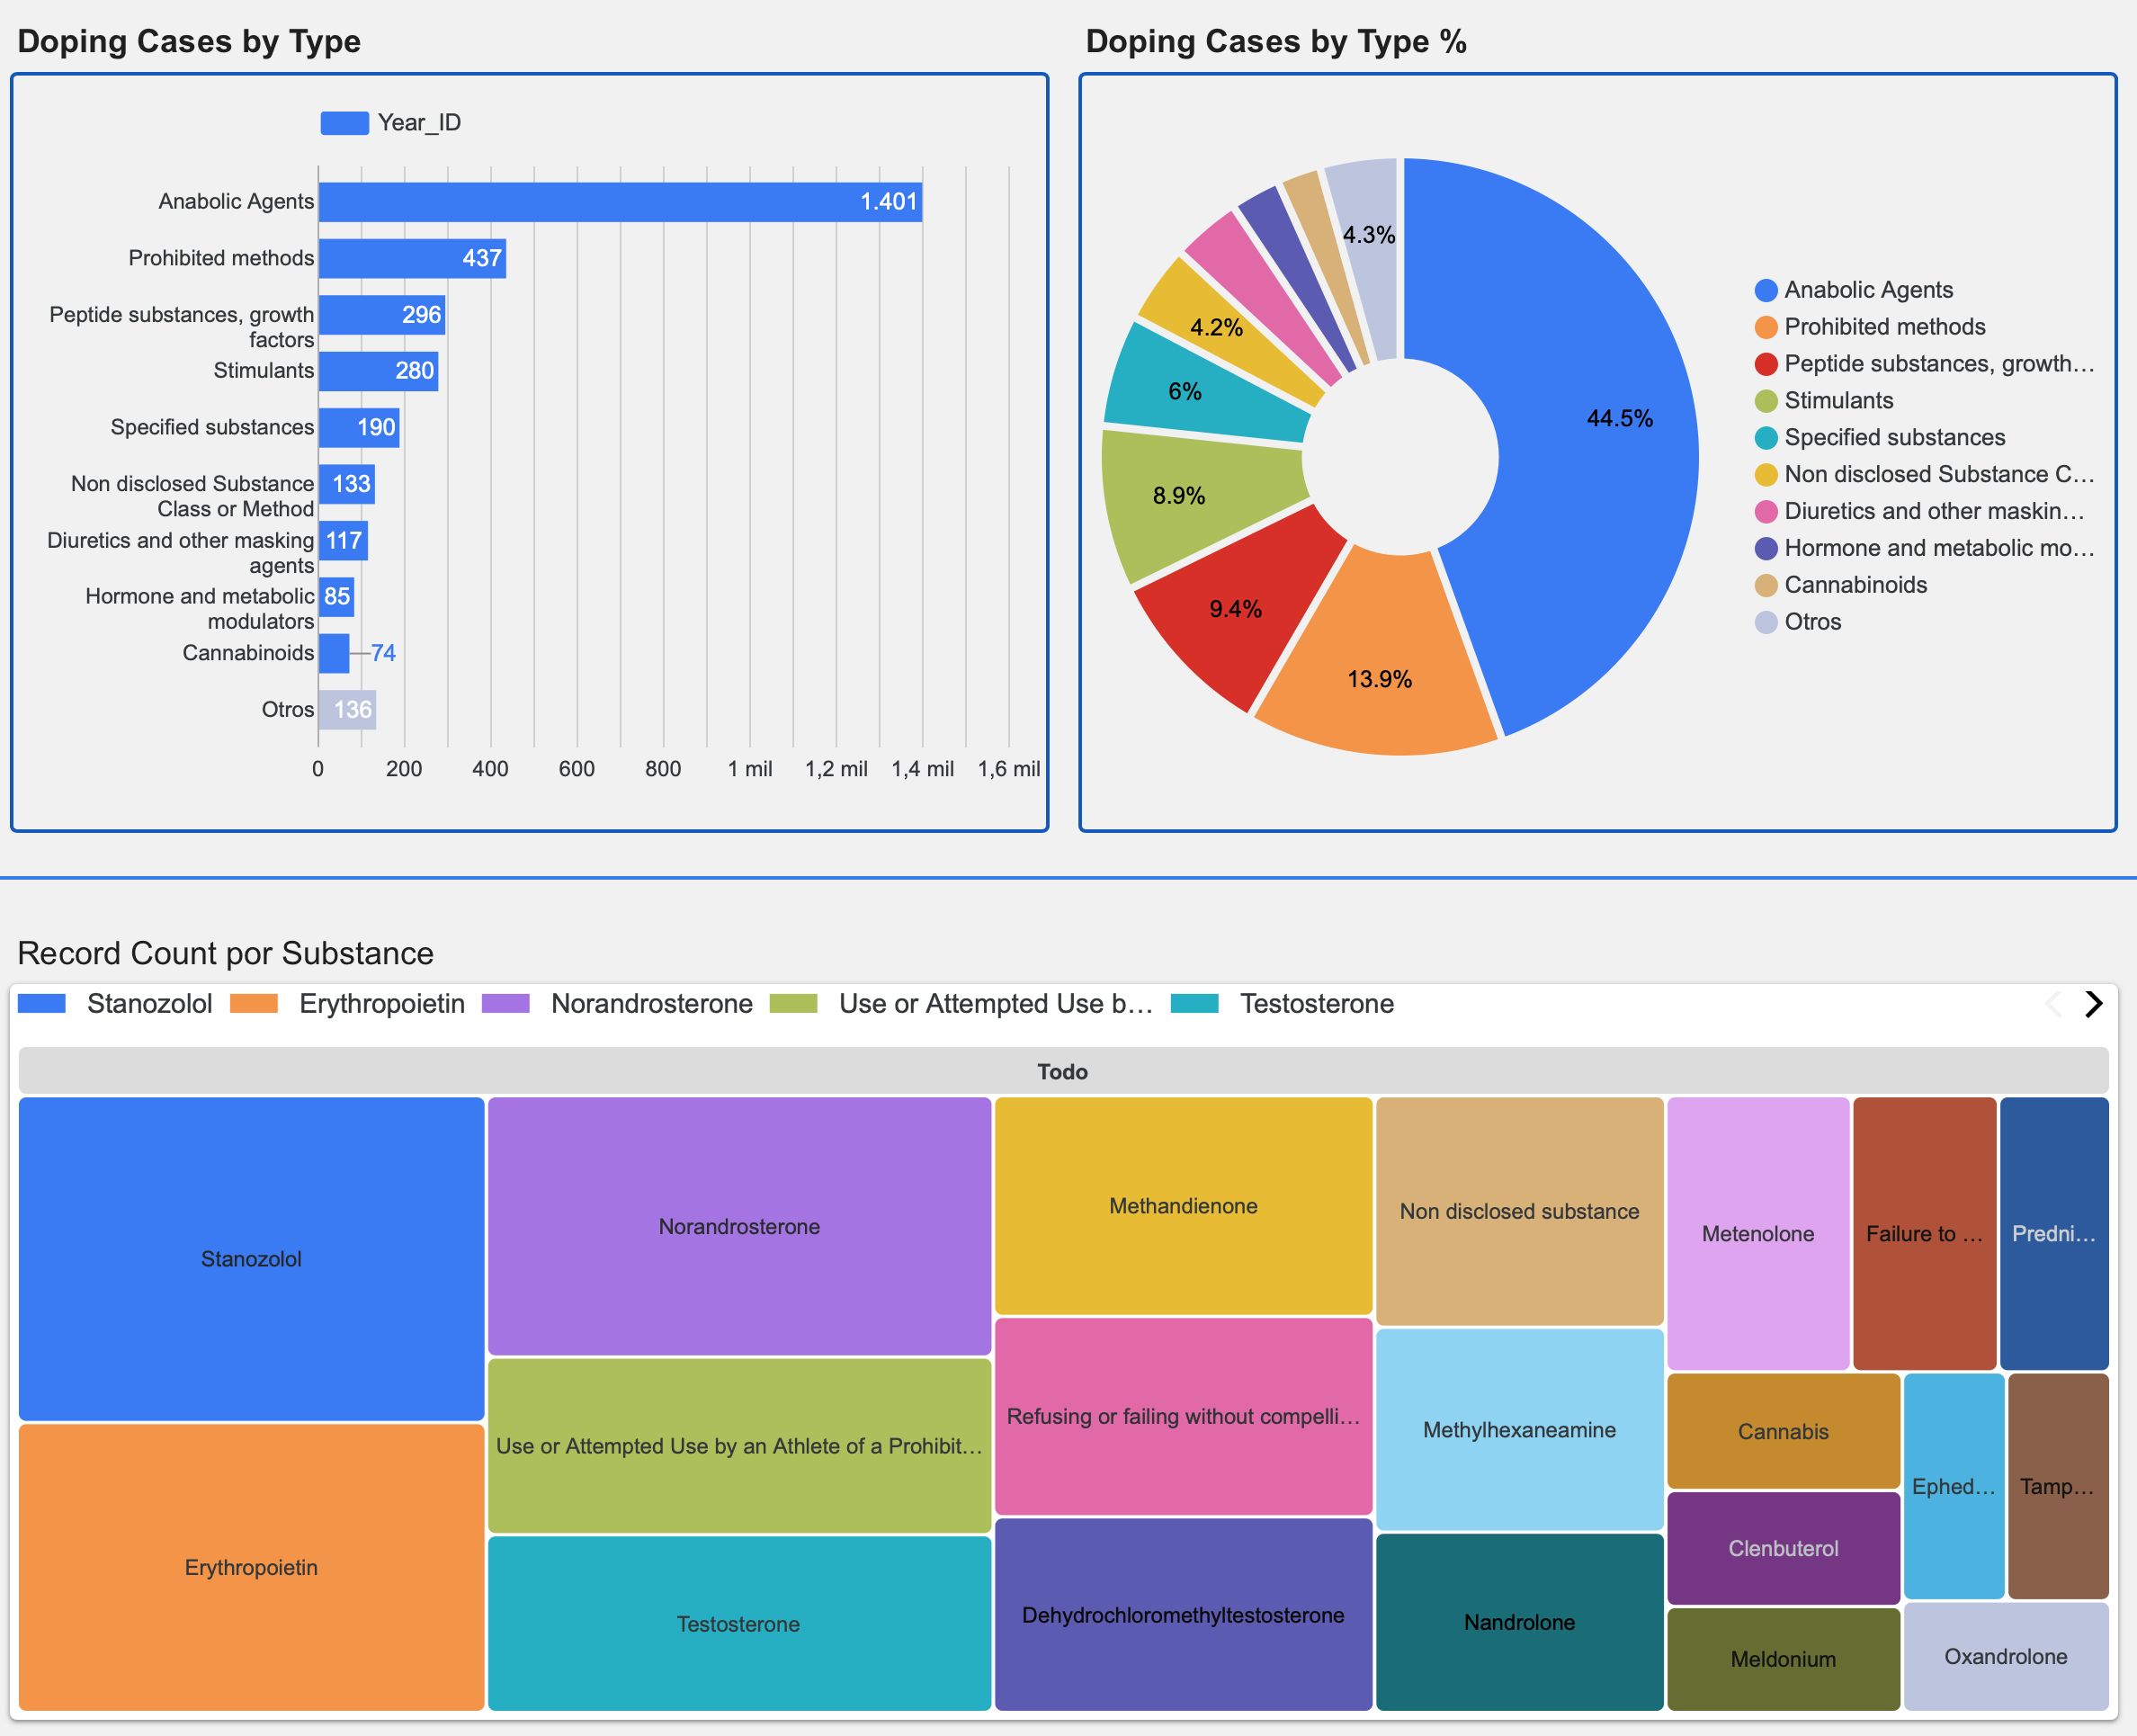
To conclude, we show the number of cases by type of doping substance. The bar chart shows the total number of cases, while the pie chart shows their percentage share.
Below, the treemap shows the incidence of the substances (Top 20) among the doping cases.
Please remember that you can filter these data using the dropdown controls above or by clicking on any of the charts.
INTERACTIVE REPORT
The report is embedded here for your convenience. In the shaded toolbar at the bottom of the report, you will find two links: one to open the report in full-screen mode and another to open it directly in Google Data Studio.
For greater flexibility, we recommend opening the report directly in Google Data Studio. It is safe and free to use.
Due to the complexity of the report, we recommend viewing it on a computer, or at least on a tablet.
(in case of use the embedded report, Click on the bottom-left navigation bar to move between the different pages of the report)
CONCLUSION
We are not in favour of the use of doping to alter the natural outcome of competition, nor are we satisfied with Athletics’ current position on this blacklist. Official bodies have taken measures to combat this problem, and we will see how effective they are in the years to come.
Next month, we expect to have the second part of this report available, in which we will attempt to assess the influence, if any, of doping on countries’ results in the Top Lists over the past 25 years.
That’s all for now. Please notify me any mistake or suggestion about how to improve our analysis.
Any comments or suggestions are very welcome.
Thank you for your attention.
