
Statistical Analysis of the Impact of Doping on Athletics (2000-2025) - PART II
AI-generated image
We are pleased to present the second part of a detailed analysis of the impact of doping on athletics, using Google Looker Studio as the platform for this interactive report.
The tool is publicly available and free to access.
The underlying data have been collected from several sources: ADDB as antidoping database, the European Athletics website, and World Athletics. Additional sources have been consulted to complement the study. Several data about Olympic Games & World Championship has been collected from the internet.
We hope you find the content interesting.
OVERVIEW
Objective of the Analysis
The aim of this analysis is to provide a historical overview, from 2000 to 2025, focusing in athletics.
This second part will attempt to assess the impact of doping on athletic performance and results, should the available data indicate a significant effect.
Methodology
The report, created in Google Data Studio (Looker Studio), allows the data to be segmented by several parameters, including countries, time period, gender, and so on. This makes it possible to perform different comparisons by applying the appropriate filters and analysing the data from the desired perspective.
The report contains two pages, which can be accessed by clicking the titles in the top navigation bar.
Although the layout adapts to the viewing interface, we recommend using a computer or, at least, a tablet for the best viewing experience.
PAGE I : Doping & RESULTS
On the first page of the report, we analyze countries with doping cases and their athletes who have exceeded the 1,100 Hungarian points threshold.
Data Selection Criteria
For the results, data were collected for all athletes who scored more than 1,100 Hungarian points in the world rankings. For events where there were fewer than 50 athletes per year scoring more than 1,100 points, the top 50 athletes were selected.
The aim is to obtain a representative sample, by country, of the number of high-level athletes, without disadvantaging events with lower scoring potential. Of course, this approach assumes that Hungarian points provide a perfectly balanced comparison between performances in different events, which may be a rather strong assumption.
Data Selection Controls
At the top of the report, you will find dropdown controls, in this page Country, Gender & Year selection are included, so the information displayed in all subsequent tables and charts will be affected in case of filtering
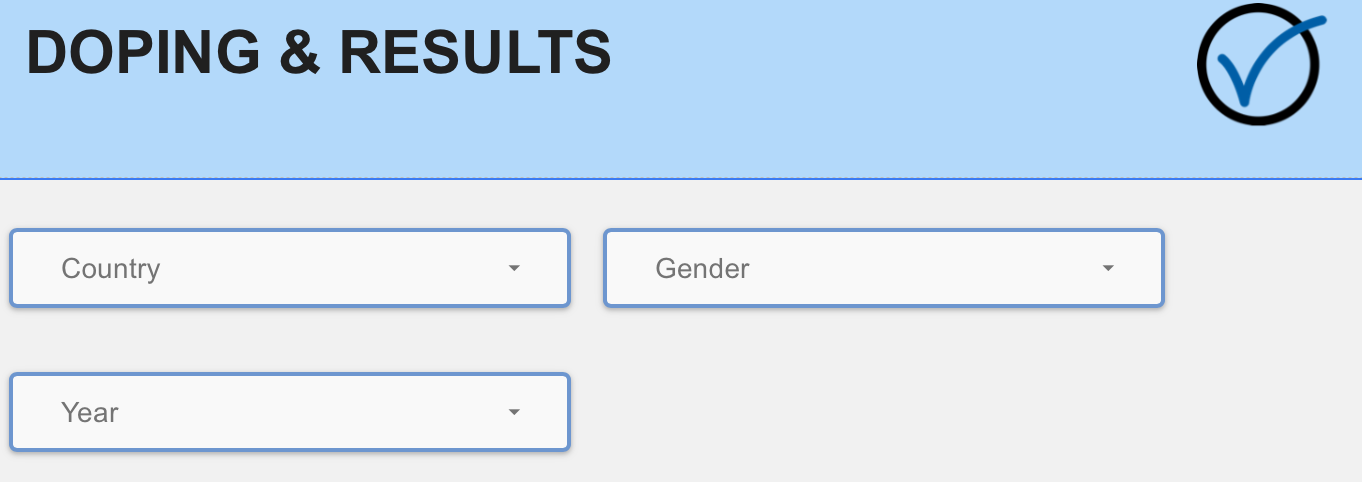
The drop-downs allow you to select one, several or all available options intuitively. The report automatically updates to reflect the selected data.
You can also filter the information by clicking directly on data points in most of the charts and tables throughout the report.
Doping Cases / Number of Athletes / Average & Max of Hungarian points
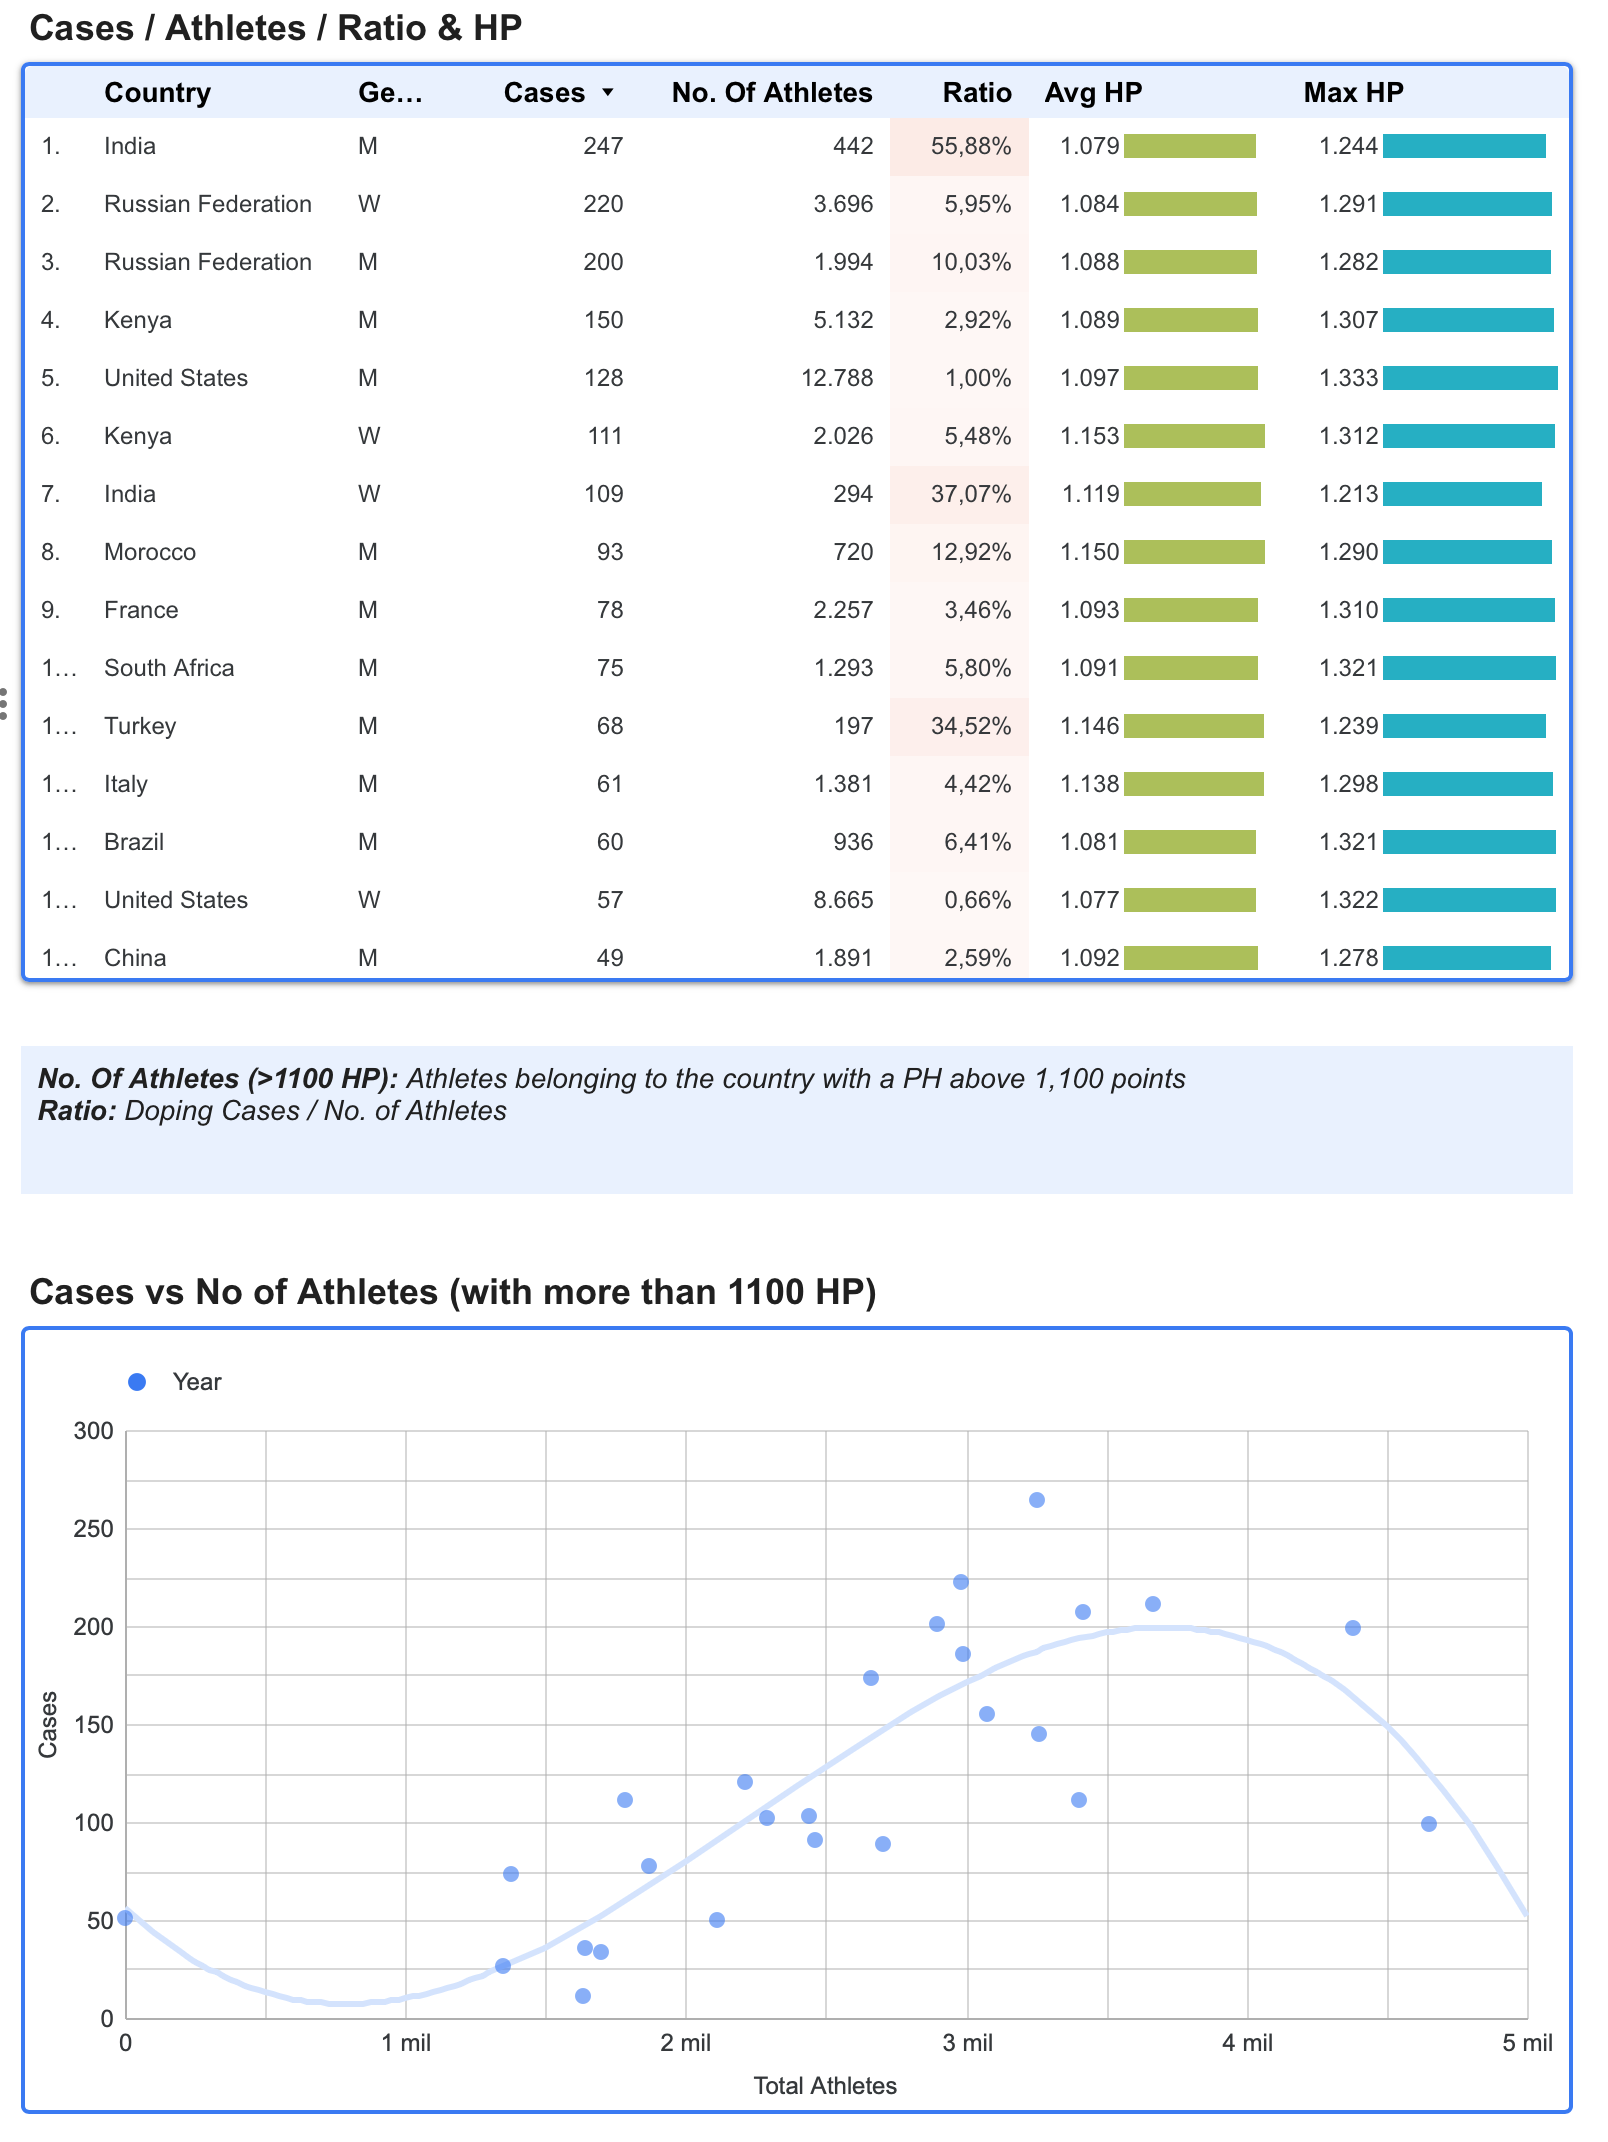
The chart shows the total number of doping cases by country and gender. It also displays the number of athletes belonging to each country with more than 1,100 HP (or the top 50 where this threshold is not reached in a given event) corresponding to each country/gender combination.
The Cases / Athletes ratio provides an indicator of the impact of doping in each country. The chart also shows the maximum HP achieved and the average HP among the athletes included in the analysis.
The scatter plot shows the potential relationship between No of Athletes (with more than 1100 HP) and the number of doping cases. We can observe the relation with both quantities.
The data displayed are affected by the selections made above.
CASES & ATHLETES EVOLUTION
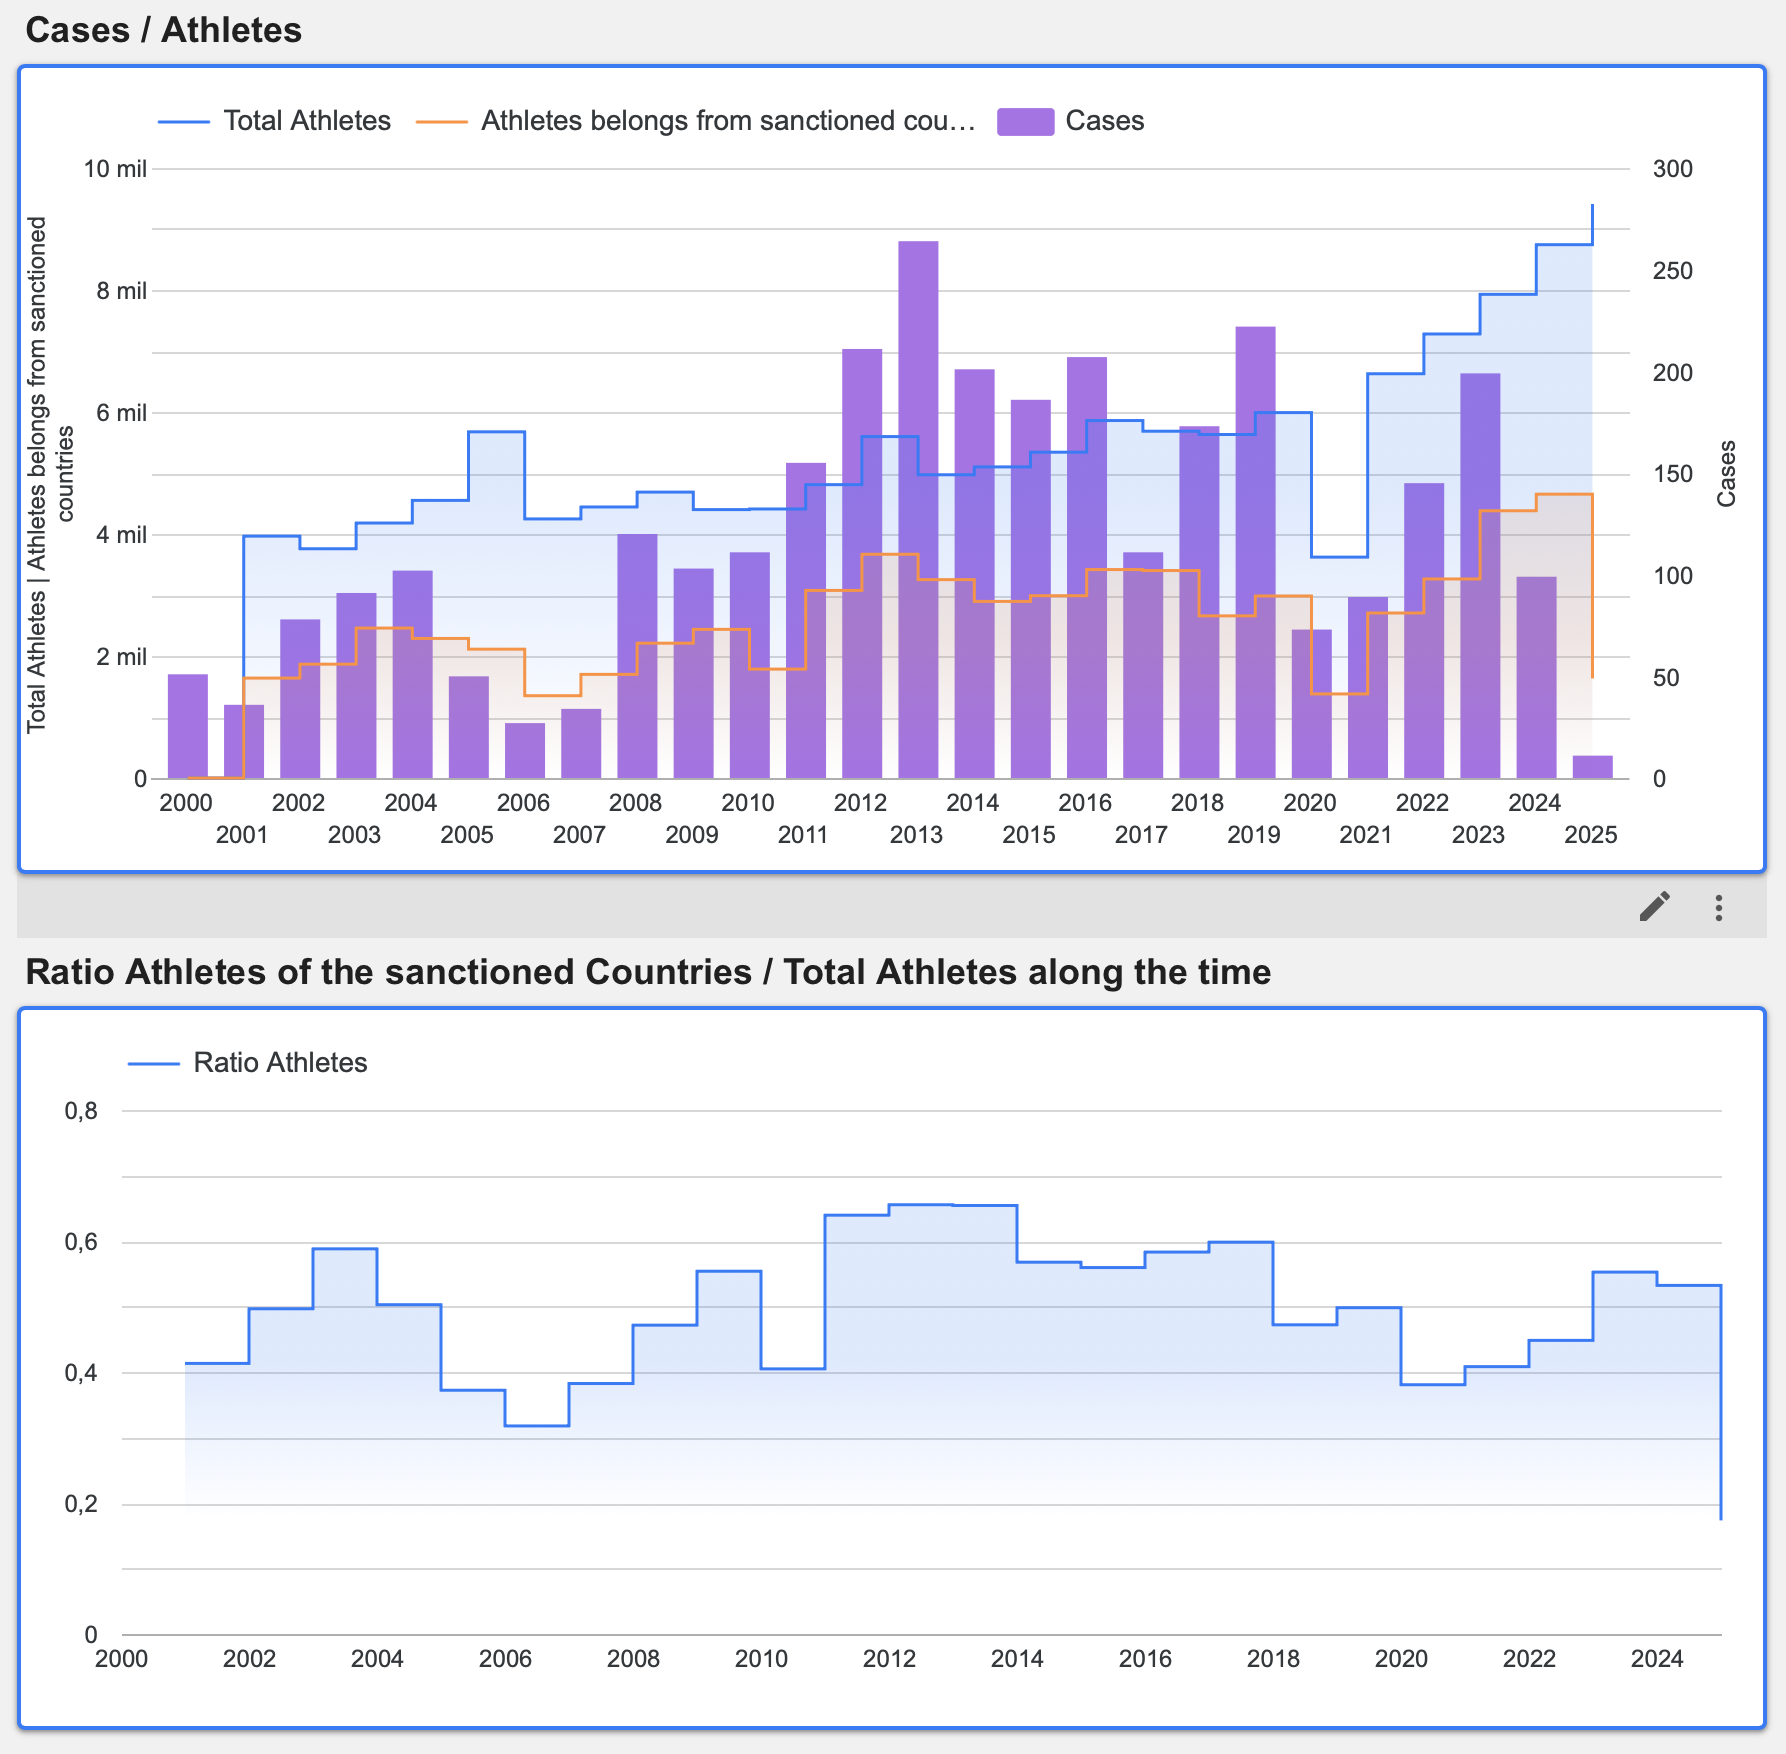
The following bar chart shows the evolution of doping cases over the study period. The blue line represents the total number of athletes each year with more than 1,100 HP, while the orange line represents the total number of athletes from sanctioned countries, also with more than 1,100 HP.
The scatter plot shows the potential relationship between Total No of Athletes (with more than 1100 HP) and the number of athletes of the countries sanctioned.
The ratio consistently remains around 50%
The data displayed are affected by the selections made above.
PAGE II : DOPING & MEDALS
On the second page, we compare doping cases with the medals won by sanctioned countries during the Olympic Games and World Championships over the analysis period..
Data Selection Controls
The drop-downs allow you to select one, several or all available options intuitively. The report automatically updates to reflect the selected data.
You can also filter the information by clicking directly on data points in most of the charts and tables throughout the report.
DOPING CASES / MEDALS (OLYMPIC GAMES & WORLD CHAMPIONSHIPS
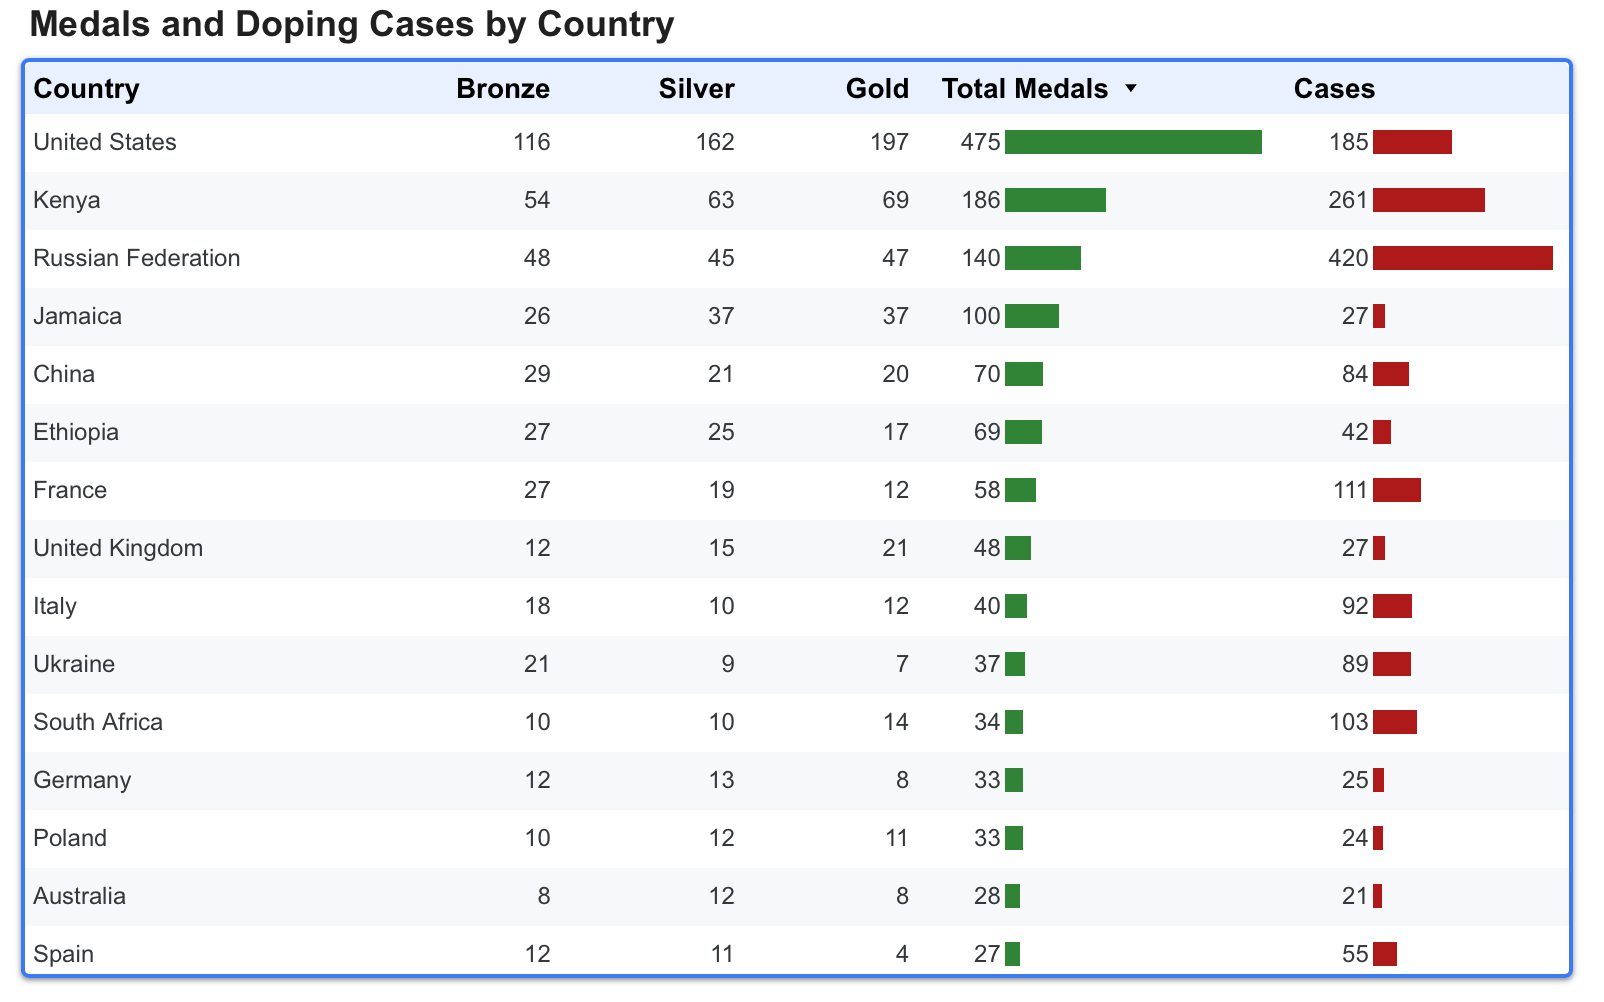
The table shows the top 20 countries with the most medals in the Olympic Games and World Championships, broken down by bronze, silver, gold, and total medals. The adjacent column shows the total number of doping cases for each country
Please remember that you can filter these data using the dropdown controls above or by clicking on any of the charts.
DISTRIBUTION OF CHAMPIONSHIPS AND DOPING CASES
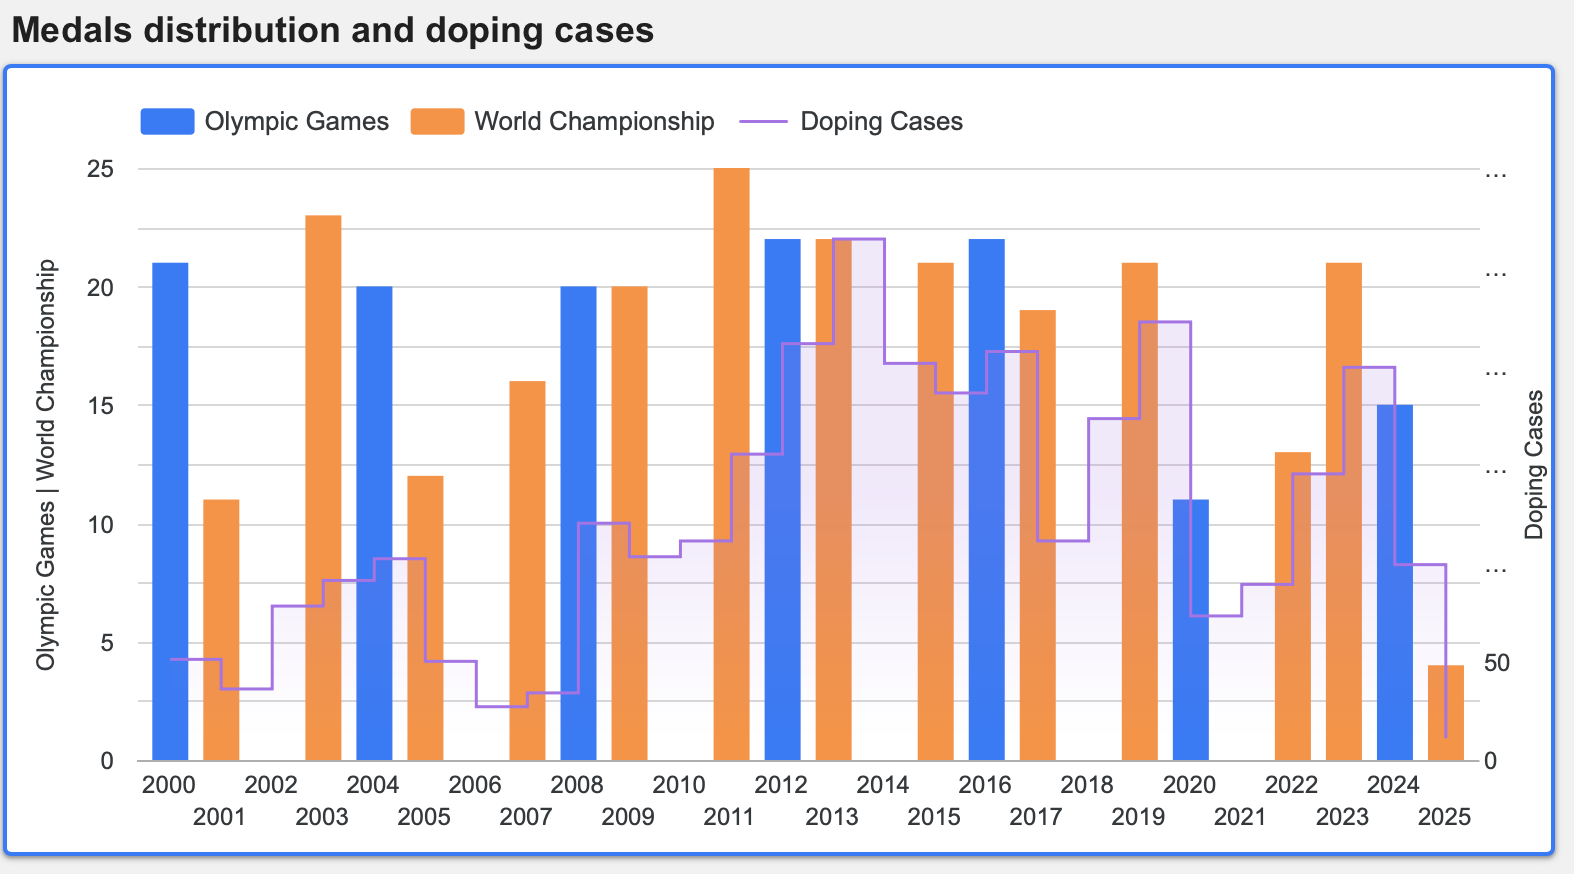
The time-series chart shows the distribution of the Olympic Games and World Championships, both represented as bars. Their size indicates the number of medals won by countries with doping cases. The line shows the total number of doping cases per year..
Between 2010 and 2020, we can observe an increase in detected doping cases, followed by a decline in medals won by the countries involved.
Please remember that you can filter these data using the dropdown controls above or by clicking on any of the charts.
MEDALS / CASES RATIO
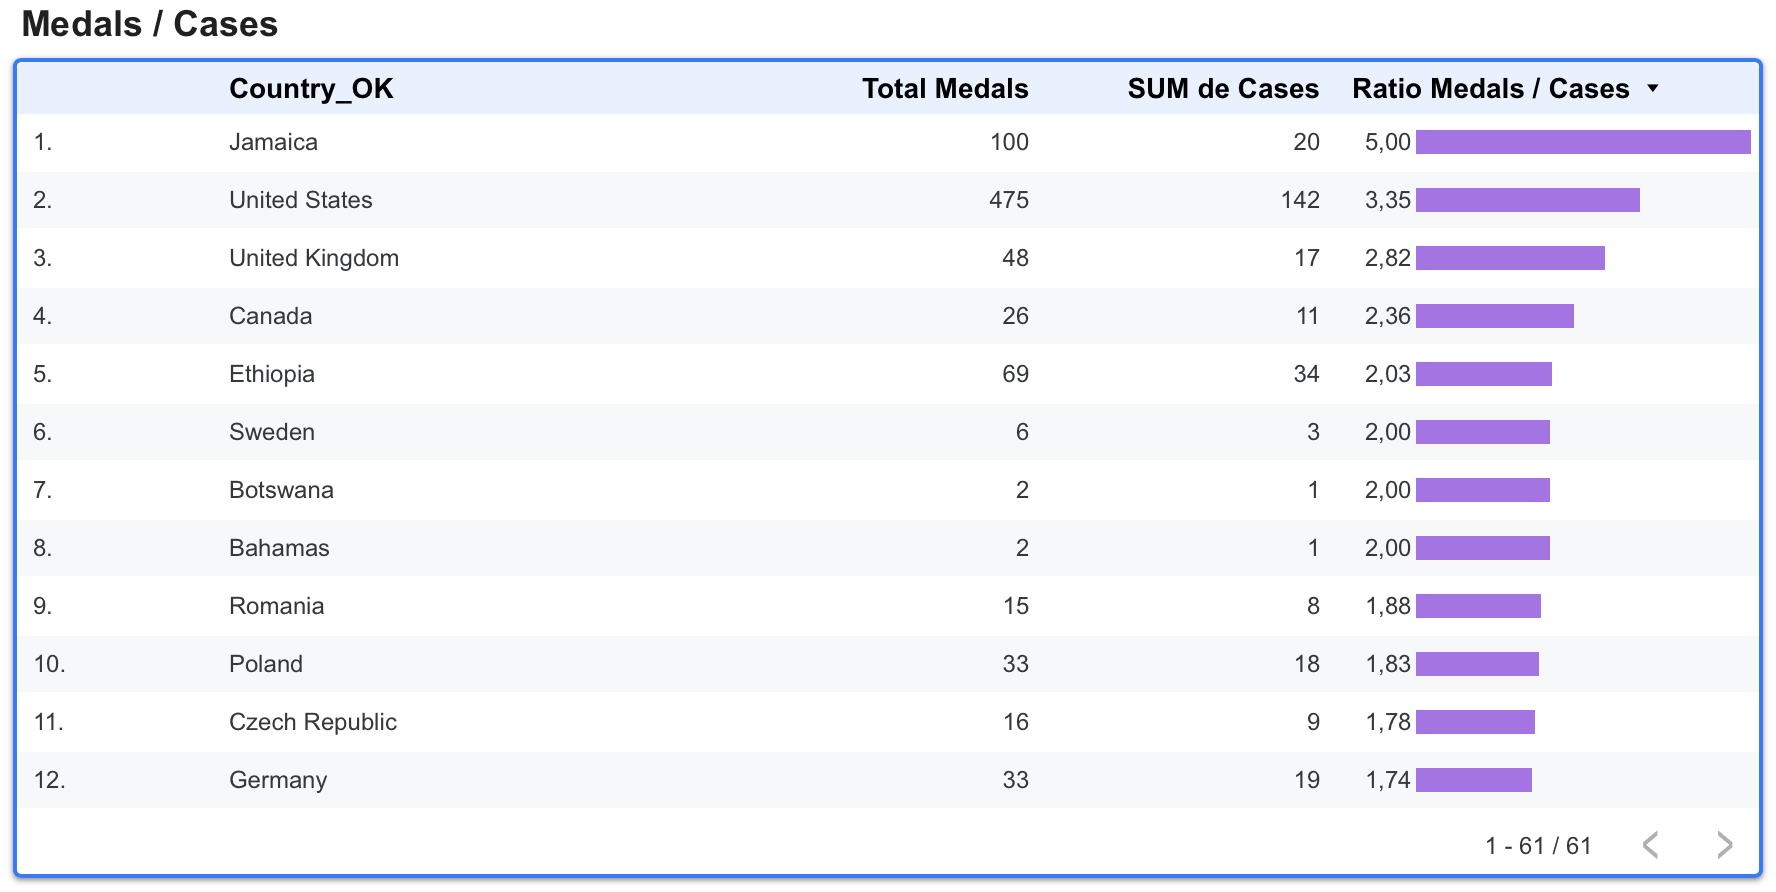
Finally, we introduce the Medals-to-Cases Ratio, which shows the number of related doping cases for countries that have won at least one medal. This ratio may indicate the level of potential misconduct in each country.
Initially, the chart is sorted by the ratio in descending order—meaning fewer doping cases relative to more medals won. You can reverse the order by clicking the Ratio column header
Please remember that you can filter these data using the dropdown controls above or by clicking on any of the charts.
INTERACTIVE REPORT
The report is embedded here for your convenience. In the shaded toolbar at the bottom of the report, you will find two links: one to open the report in full-screen mode and another to open it directly in Google Data Studio.
For greater flexibility, we recommend opening the report directly in Google Data Studio. It is safe and free to use.
Due to the complexity of the report, we recommend viewing it on a computer, or at least on a tablet.
(in case of use the embedded report, Click on the bottom-left navigation bar to move between the different pages of the report)
CONCLUSION
A quick review of the report indicates that the countries with the highest medal counts—regardless of their size or population—have also recorded the most doping cases.
Russia is a notable example. Since being excluded from major competitions by WADA in 2020 due to the manipulation of anti-doping test results, there has been a clear decline in doping cases.
In recent years, this issue appears to be decreasing. Official bodies have introduced numerous measures to combat such unfair practices. Hopefully, this downward trend will continue and reflect a genuine reduction in cheating, rather than athletes becoming more successful at evading detection.
That’s all for now. Please notify me any mistake or suggestion about how to improve our analysis.
Any comments or suggestions are very welcome.
Thank you for your attention.
