
STATISTICAL ANALYSIS OF WORLD ATHLETICS: THROWING EVENTS
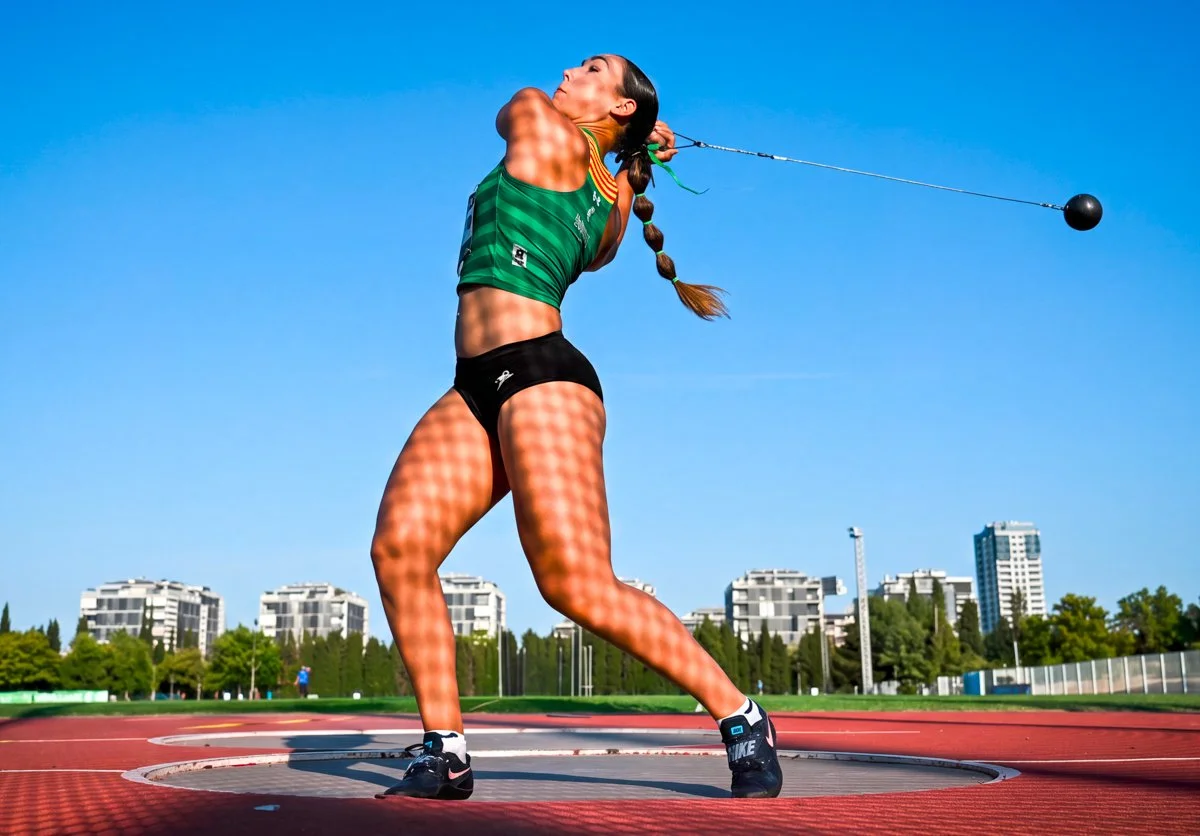
Photo courtesy of Andrea Sales.
With this post on throwing events, we begin a statistical journey through the different athletics disciplines. We hope you find it of interest.
The data are presented in Google Data Studio, allowing readers to select and filter the information. The tool is publicly available and free to access.
The underlying data have been collected from the European Athletics website, and World Athletics. Additional sources have been consulted to complement the study.
We hope you find the content interesting.
OVERVIEW
Objective of the Analysis
The aim of the analysis is to provide a historical overview of throwing events, showing results and participation by athletes and countries, while also benchmarking performance against other athletics disciplines.
Methodology
The report, created in Google Data Studio (Looker Studio), allows the data to be segmented by several parameters, including countries, time period, gender, and so on. This makes it possible to perform different comparisons by applying the appropriate filters and analysing the data from the desired perspective.
The report contains six pages, which can be accessed by clicking the titles in the top navigation bar.
Although the layout adapts to the viewing interface, we recommend using a computer or, at least, a tablet for the best viewing experience.
Data selection criteria
For the results, data were collected for all athletes who scored more than 1,100 Hungarian points in the world rankings. For events where there were fewer than 50 athletes per year scoring more than 1,100 points, the top 50 athletes were selected. The aim is to obtain a representative sample, by country, of the number of high-level athletes, without disadvantaging events with lower scoring potential. Of course, this approach assumes that Hungarian points provide a perfectly balanced comparison between performances in different events, which may be a rather strong assumption.
It is important to note that, in all cases, only each athlete’s best performance has been selected. Therefore, each athlete appears only once in any given ranking, based on their personal best.
The analysis period covers 2001 to 2025. However, to provide a more complete picture, world-record data from any date have also been included.
PAGE I : THROWING IN WORLD ATHLETICS 2001-2025
The first page of the report presents information on world records and the top 20 performances for each event, the progression of results across the four throwing disciplines, and results by country.
Data Selection Controls
At the top of the report, you will find dropdown controls, in this page Country, Gender & Year selection are included, so the information displayed in all subsequent tables and charts will be affected in case of filtering

The drop-downs allow you to select one, several or all available options intuitively. The report automatically updates to reflect the selected data.
You can also filter the information by clicking directly on data points in most of the charts and tables throughout the report.
All Time World Records & TOP 20 historical results
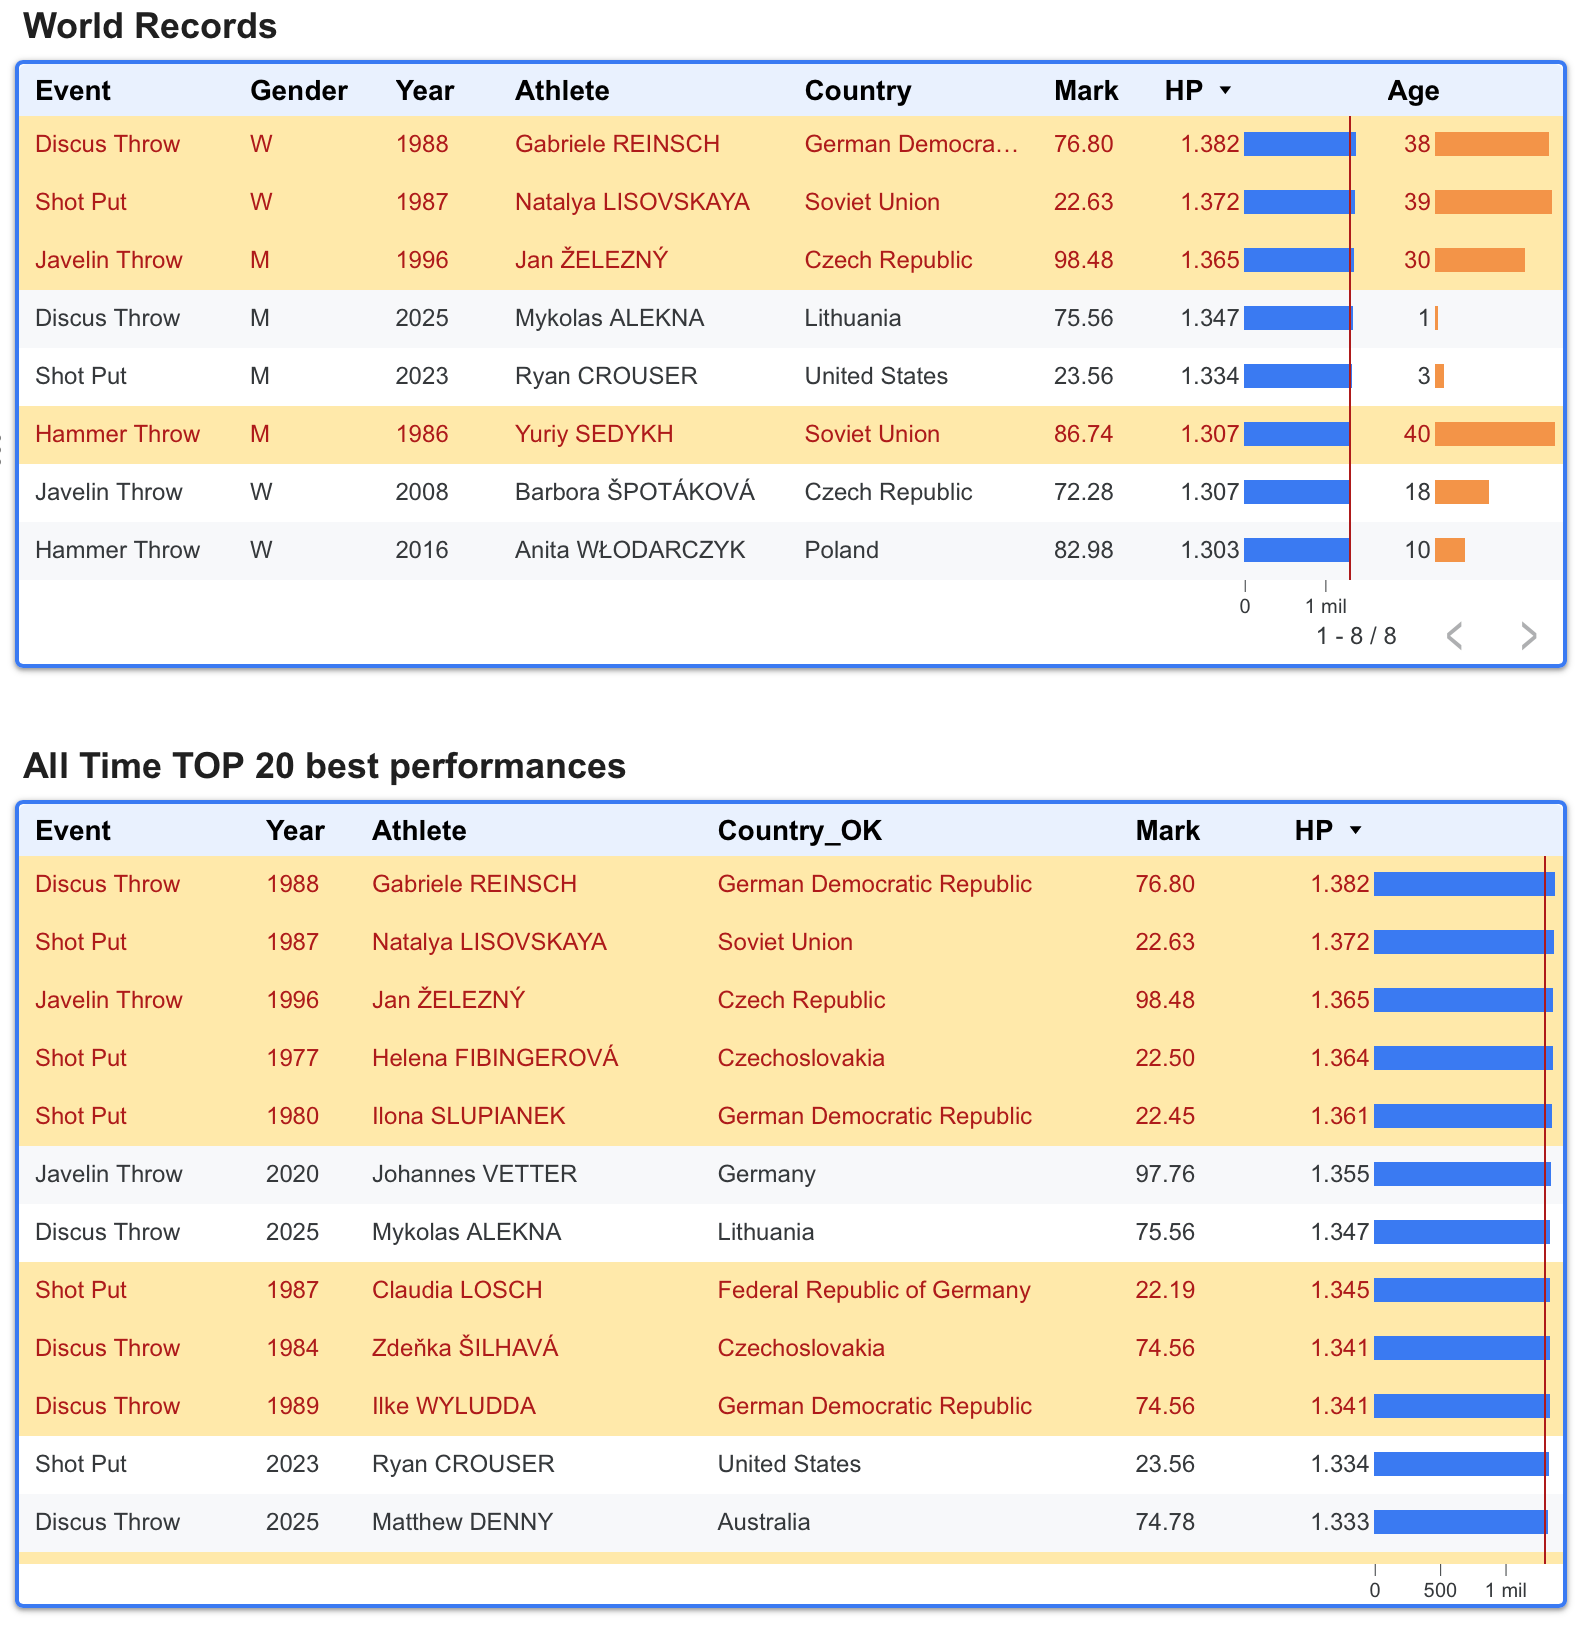
The first chart shows the current records for each event, including the performance expressed in Hungarian points (HP) and the age of each record.
The second chart shows the top 20 all time performances ranked by Hungarian points. Each athlete appears only once, based on their best performance.
As shown by the age of the records and best performances, several still date back to the 1980s and 1990s and were set by athletes from Eastern European countries, which raises questions about their legitimacy. (These data are highlighted in orange.)
(Remember that you can filter the data using the dropdown menus above, or by clicking on data points in most charts and tables)
2001-2025 Performance Evolution
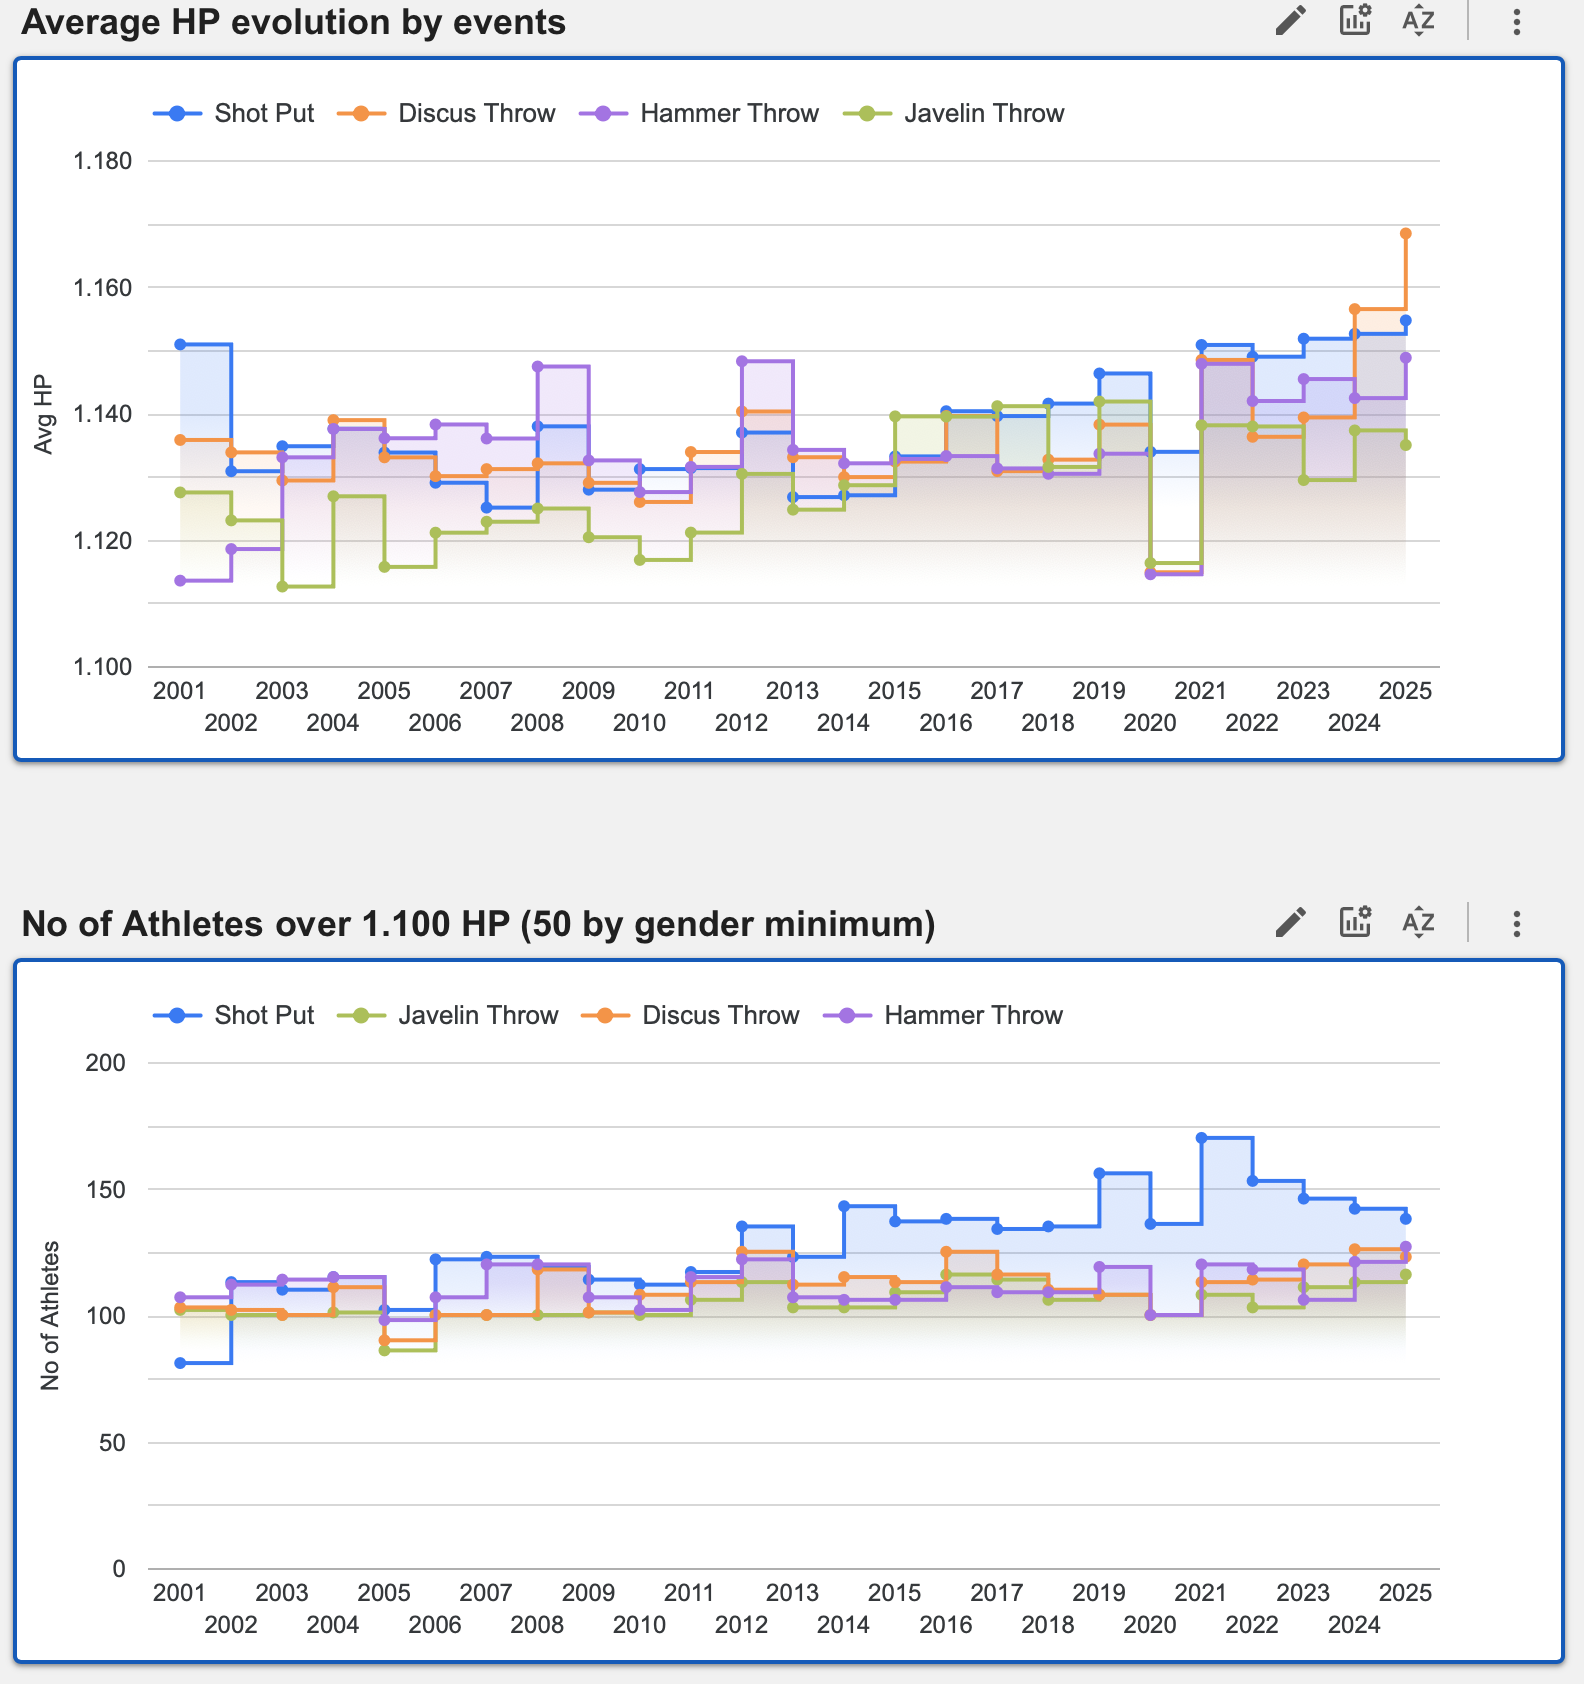
The first chart shows the average results along the time by events. Clicking on the upper bar of the graphic "optional Metrics" you can change Average / Max Hungarian points.
The second chart shows the number of athletes with more than 1100 HP by year in each event. in case of less than 50 by gender, the first 50 by gender are in the graphic
(Remember that you can filter the data using the dropdown menus above, or by clicking on data points in most charts and tables)
Performance by Countries
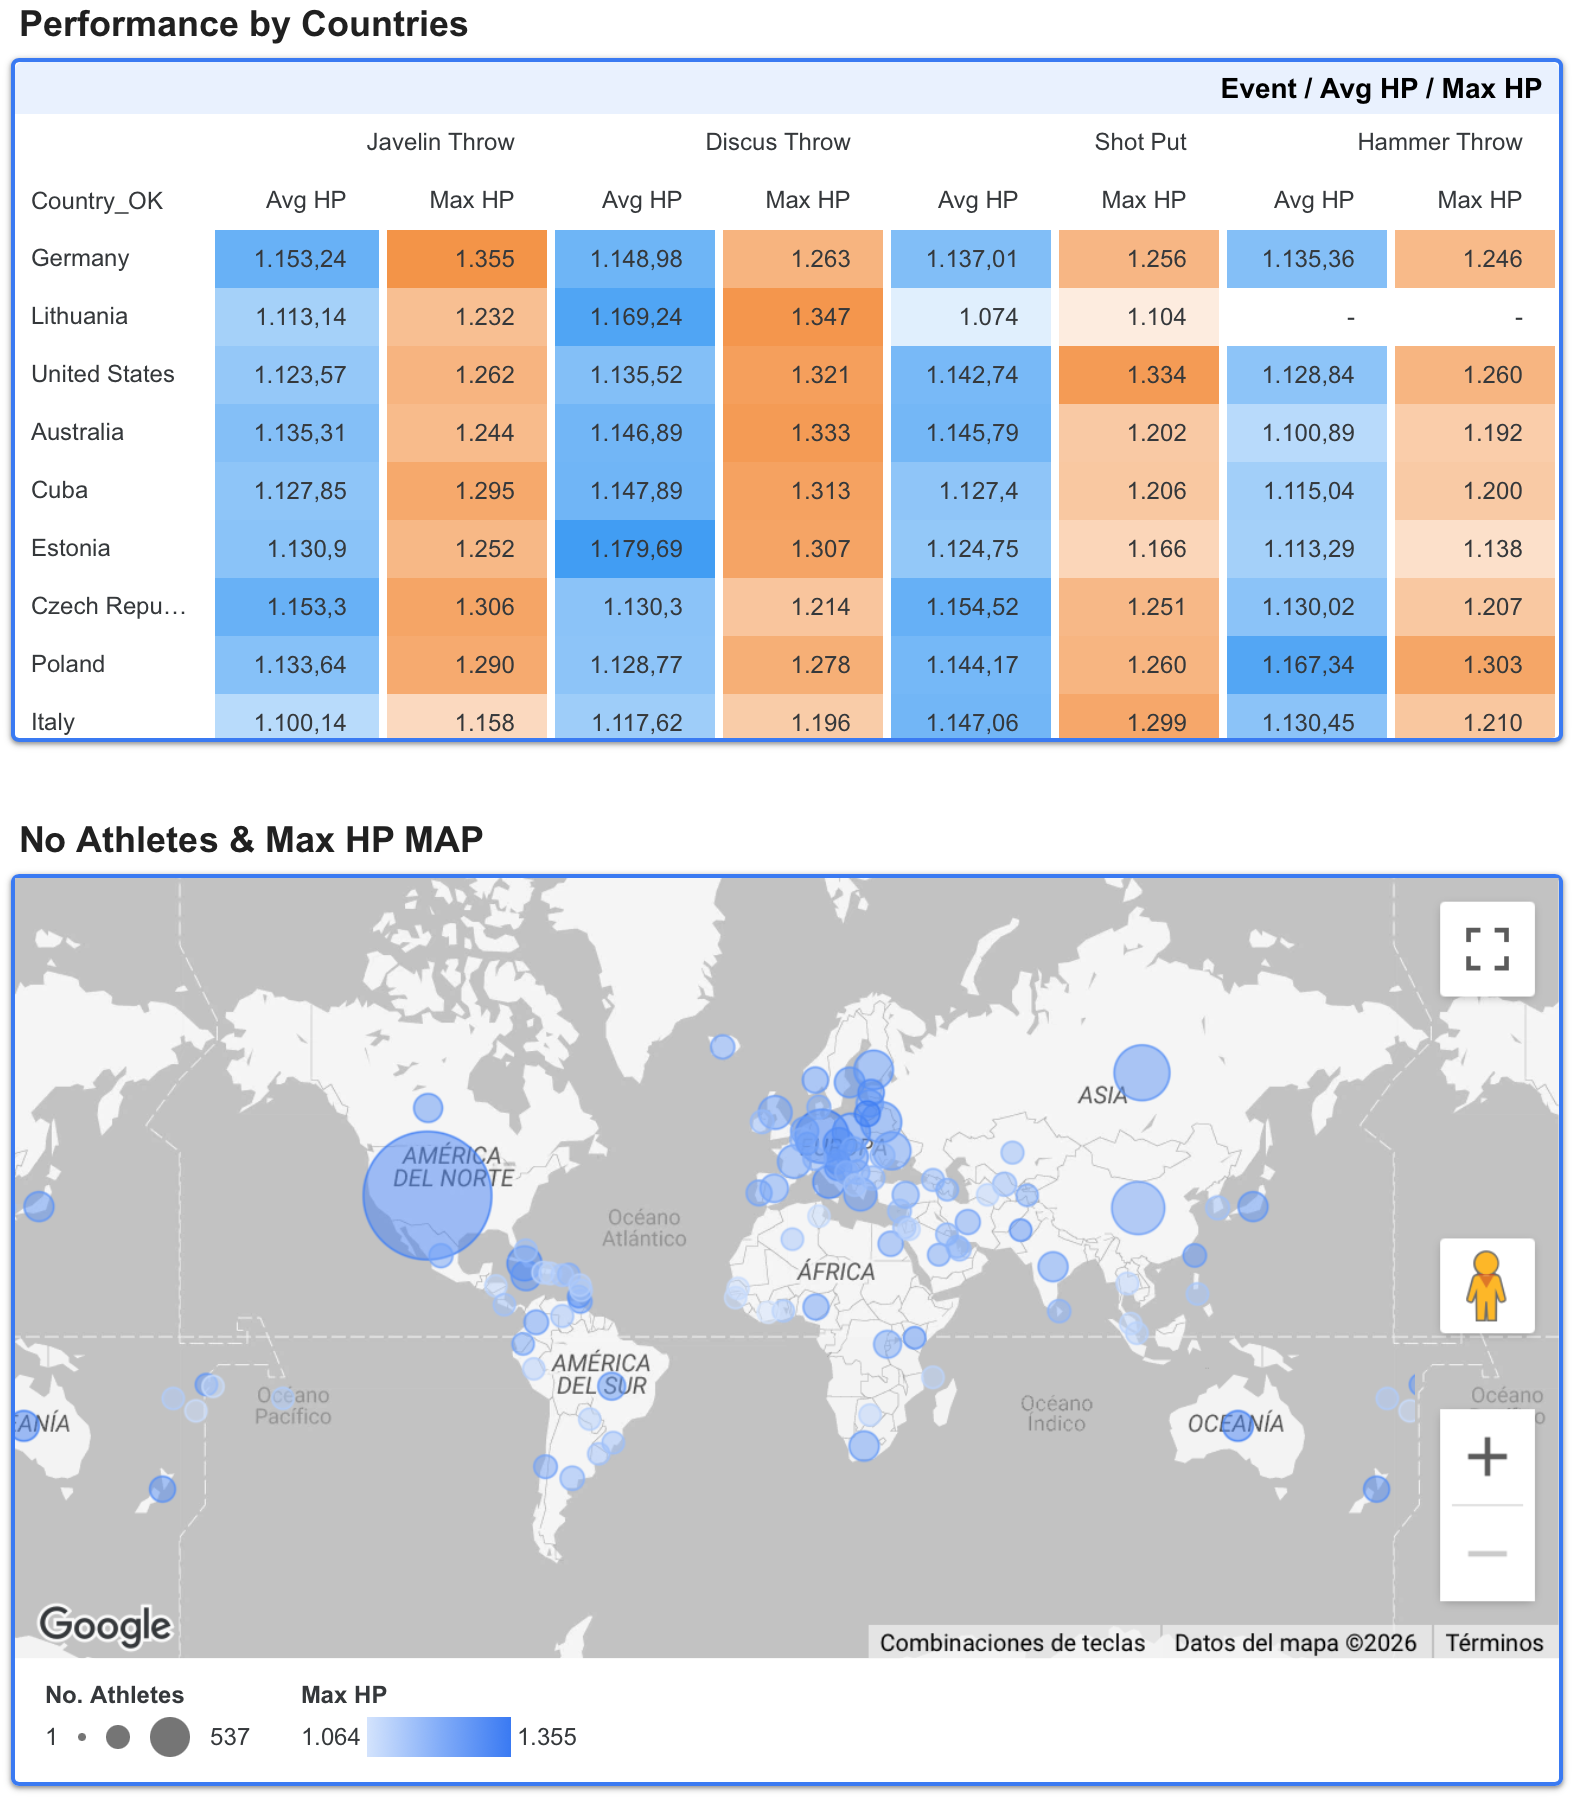
The following table shows each country’s performance in each event, including the average Hungarian points score and the maximum score.
The map below displays the countries, with bubble size representing the number of athletes from each country and the color scale indicating each country’s maximum Hungarian points score. The drop-down menus at the top can be used to filter the view by a specific event.
PAGE II : Throwing Events Versus Other Disciplines
On the second page, we compare throwing events with the other athletics disciplines.
Data Selection Controls
The drop-downs allow you to select one, several or all available options intuitively. The report automatically updates to reflect the selected data.
You can also filter the information by clicking directly on data points in most of the charts and tables throughout the report.
Comparison Across Events: Number of Athletes, Maximum Score, and Average Hungarian Points
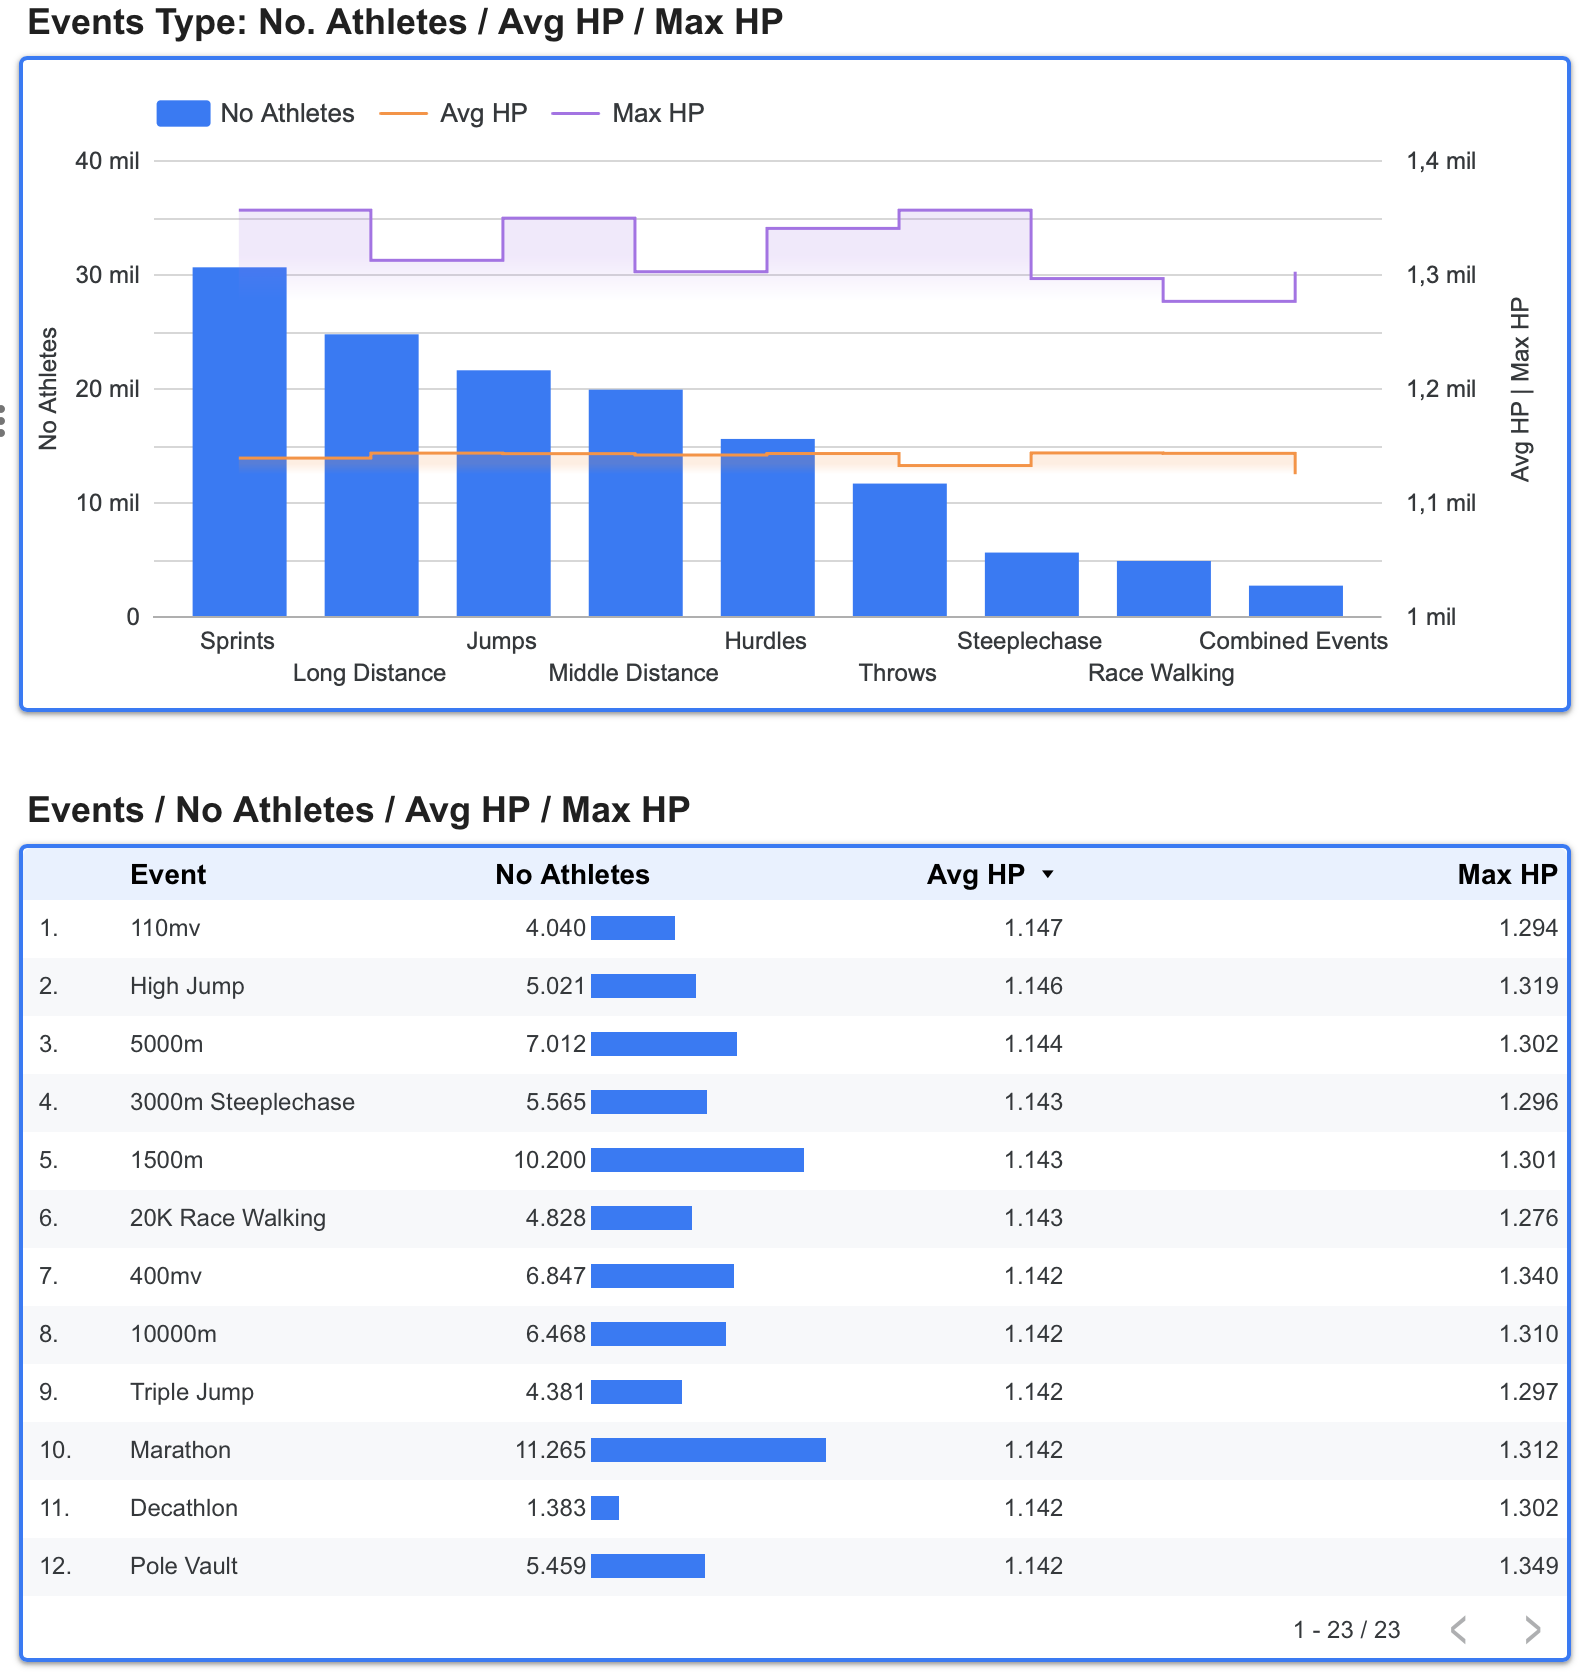
The chart compares the different event categories, including the total number of athletes and the average and maximum Hungarian points achieved during the analysis period (2001–2025).
The following table provides a more detailed breakdown by event, initially sorted by average Hungarian points in descending order. It highlights the events with the highest average scores among athletes exceeding 1,100 points—or the top 50 athletes where that threshold is not reached. As shown, throwing events appear at the bottom of the table.
In fact, even when sorting by any other column, throwing events remain near the bottom of the table.
Please remember that you can filter these data using the dropdown controls above or by clicking on any of the charts.
Data Trends Over Time (2001–2025)
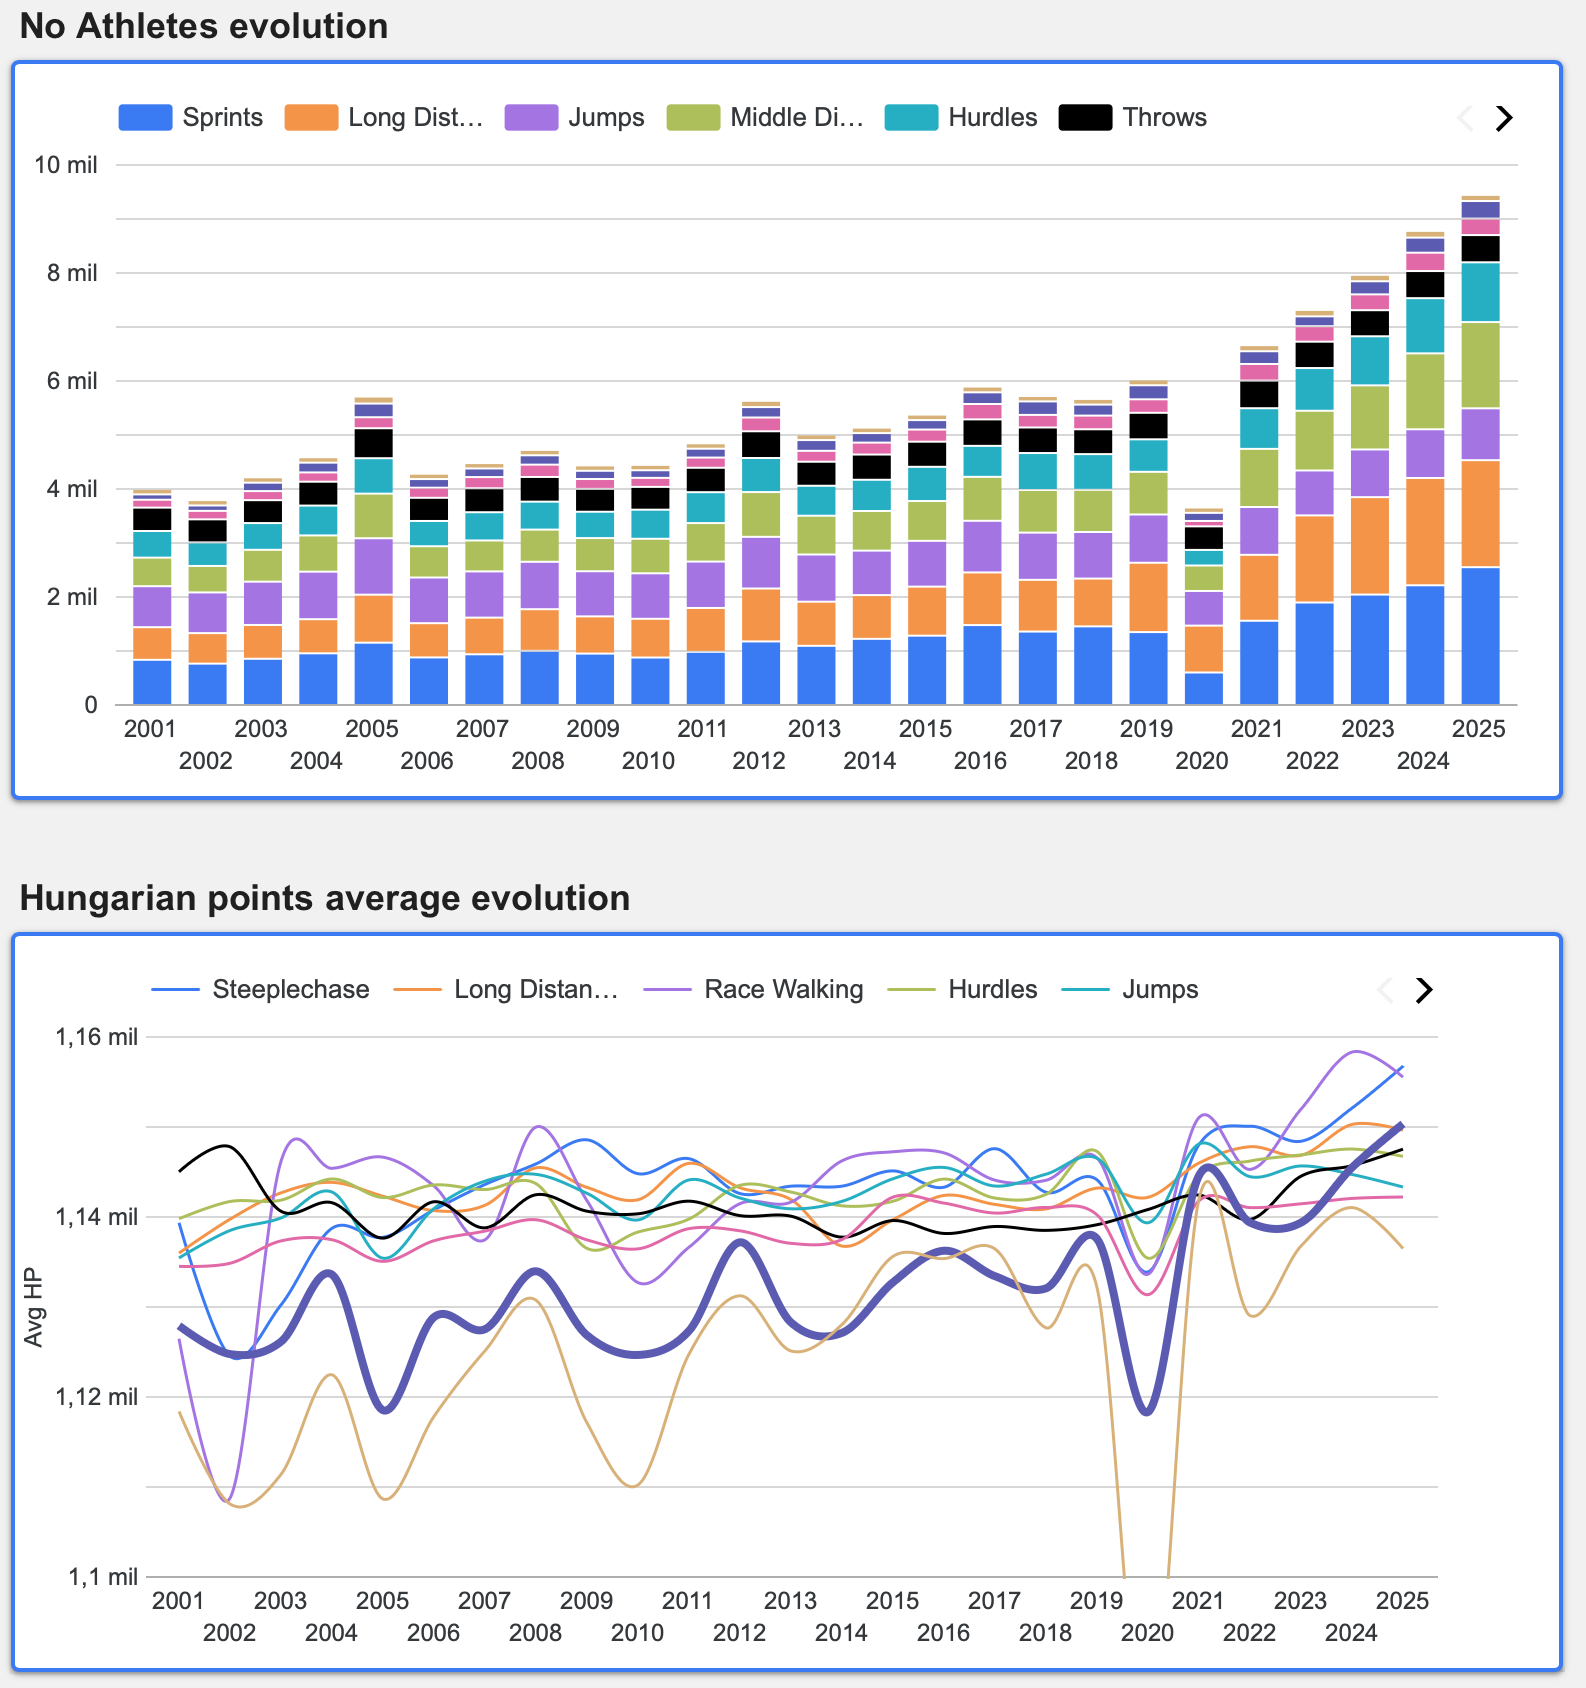
The first chart uses stacked bars to show the number of athletes scoring above 1,100 points—or the top 50 athletes where that threshold is not reached. Excluding the COVID-affected year, athletics shows steady progress in performance quality, while throwing events remain relatively low in the ranking. It should be noted that some disciplines include only one event, whereas throwing comprises four.
The second chart shows the trend in average Hungarian points over time. Aside from the COVID-related dip, it also reflects a gradual improvement in performances across all event categories, including throwing events.
Please remember that you can filter these data using the dropdown controls above or by clicking on any of the charts.
PAGE III, IV, V & VI : EVENT DETAILS
The following pages present detailed information on each of the four throwing events. As the format is the same for all of them, we show here Page III, which covers the shot put. All event pages can be explored in the interactive report.
Data Selection Controls
The drop-downs allow you to select one, several or all available options intuitively. The report automatically updates to reflect the selected data.
You can also filter the information by clicking directly on data points in most of the charts and tables throughout the report.
Shot Put Evolution: Number of Athletes, Average / Max Hungarian Points and WR
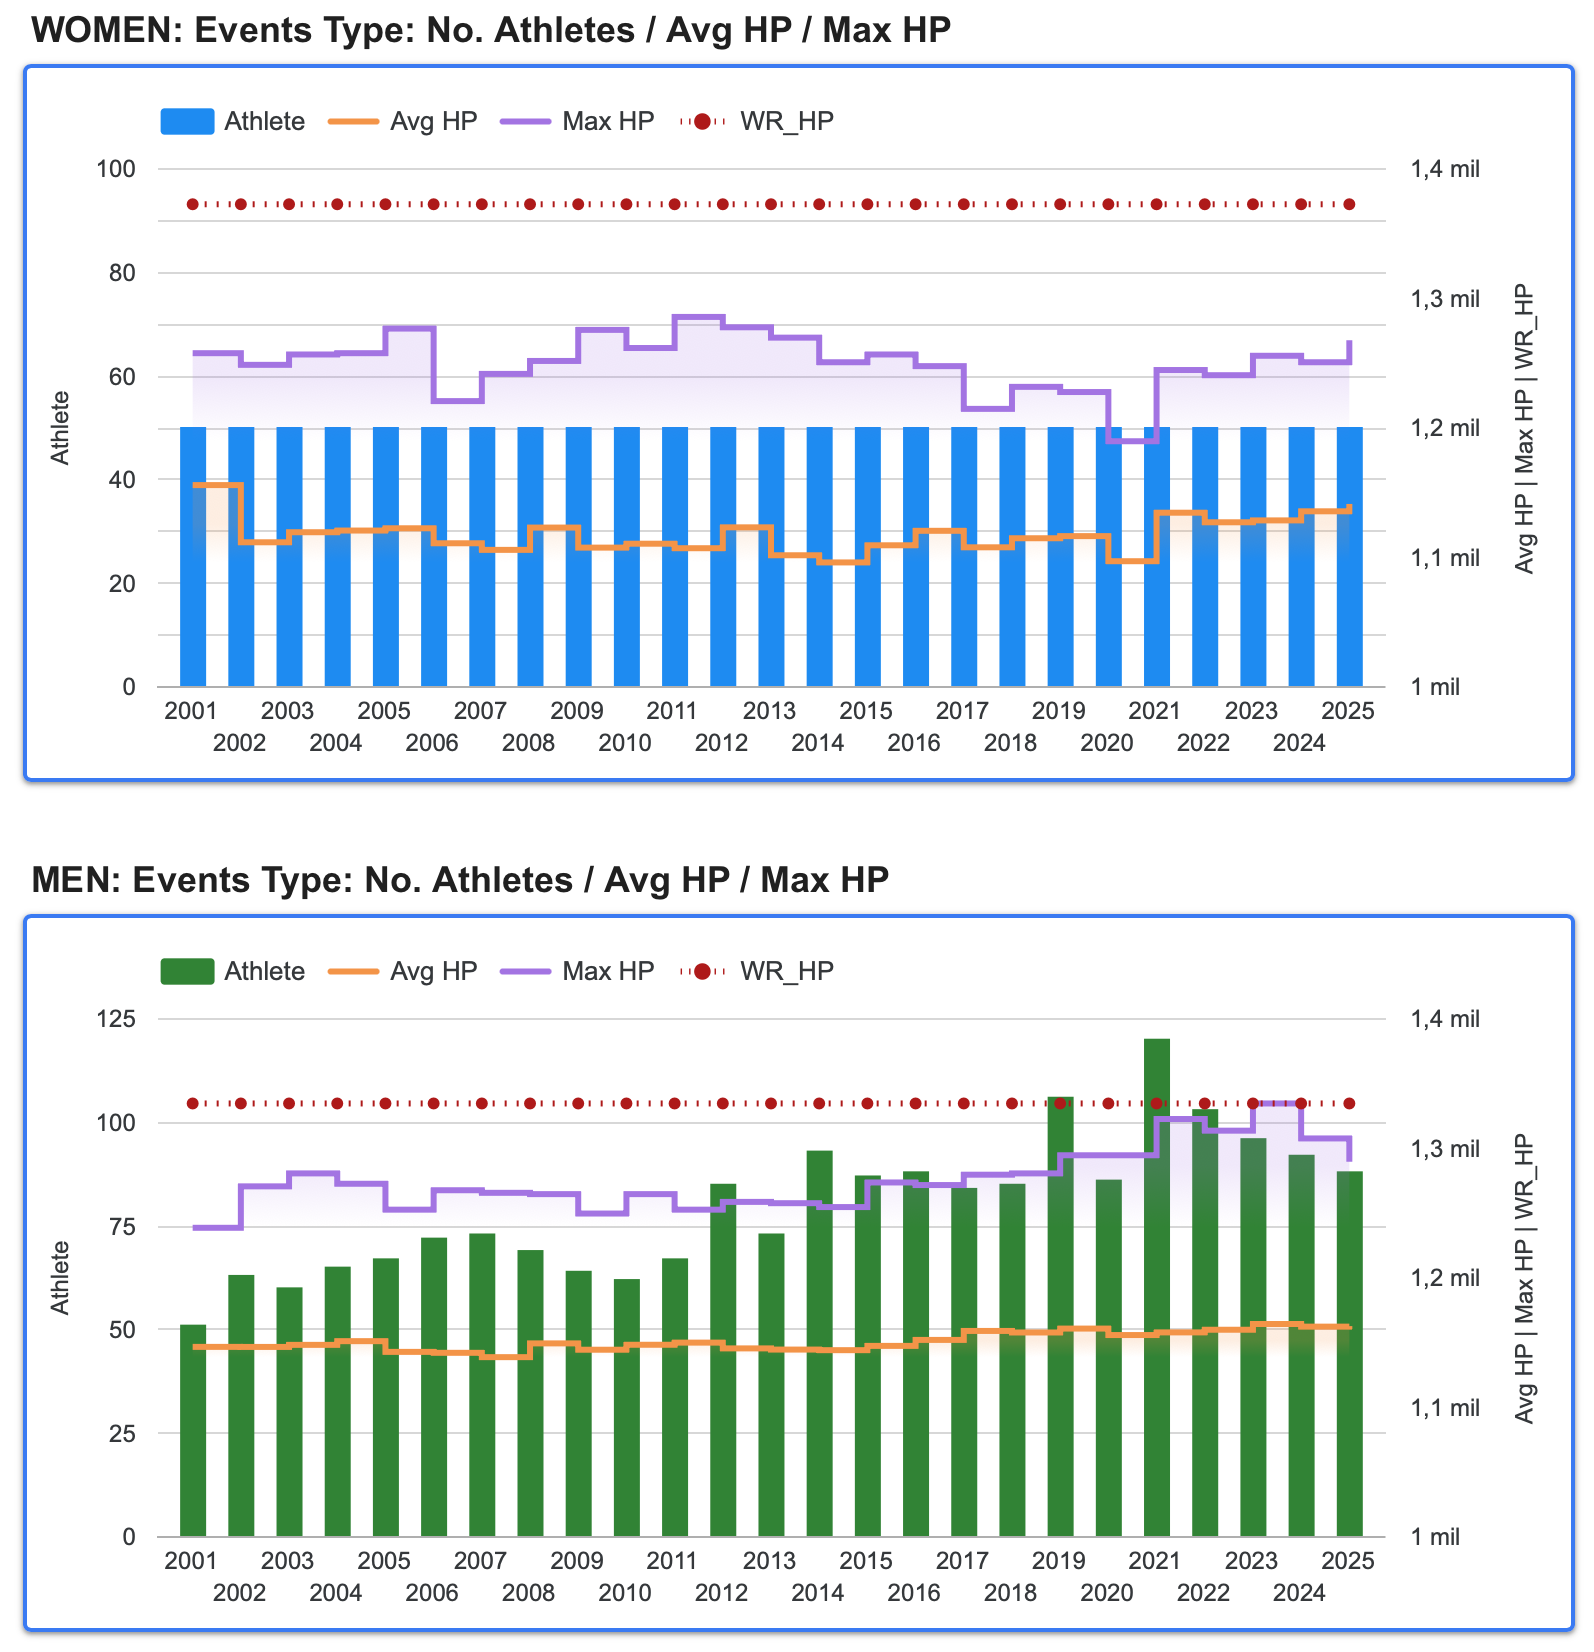
The following two charts show the evolution of the shot put over the analysis period: the first for female athletes and the second for male athletes. They include the number of athletes, average and maximum Hungarian points, and, for reference, a dotted line indicating the world record.
For the women’s event, no year exceeds 50 athletes, meaning fewer than 50 athletes reached 1,100 points. There is also no noticeable improvement in either the average or maximum performances, which remain well below the world record of 22.63 m, set in 1988.
The men’s event presents a different picture. The number of athletes exceeding 1,100 points clearly surpasses 50 and shows an upward trend. In terms of performances, Ryan Crouser’s 2023 world record of 23.56 m stands out.
Please remember that you can filter these data using the dropdown controls above or by clicking on any of the charts.
Shot Put by Countries
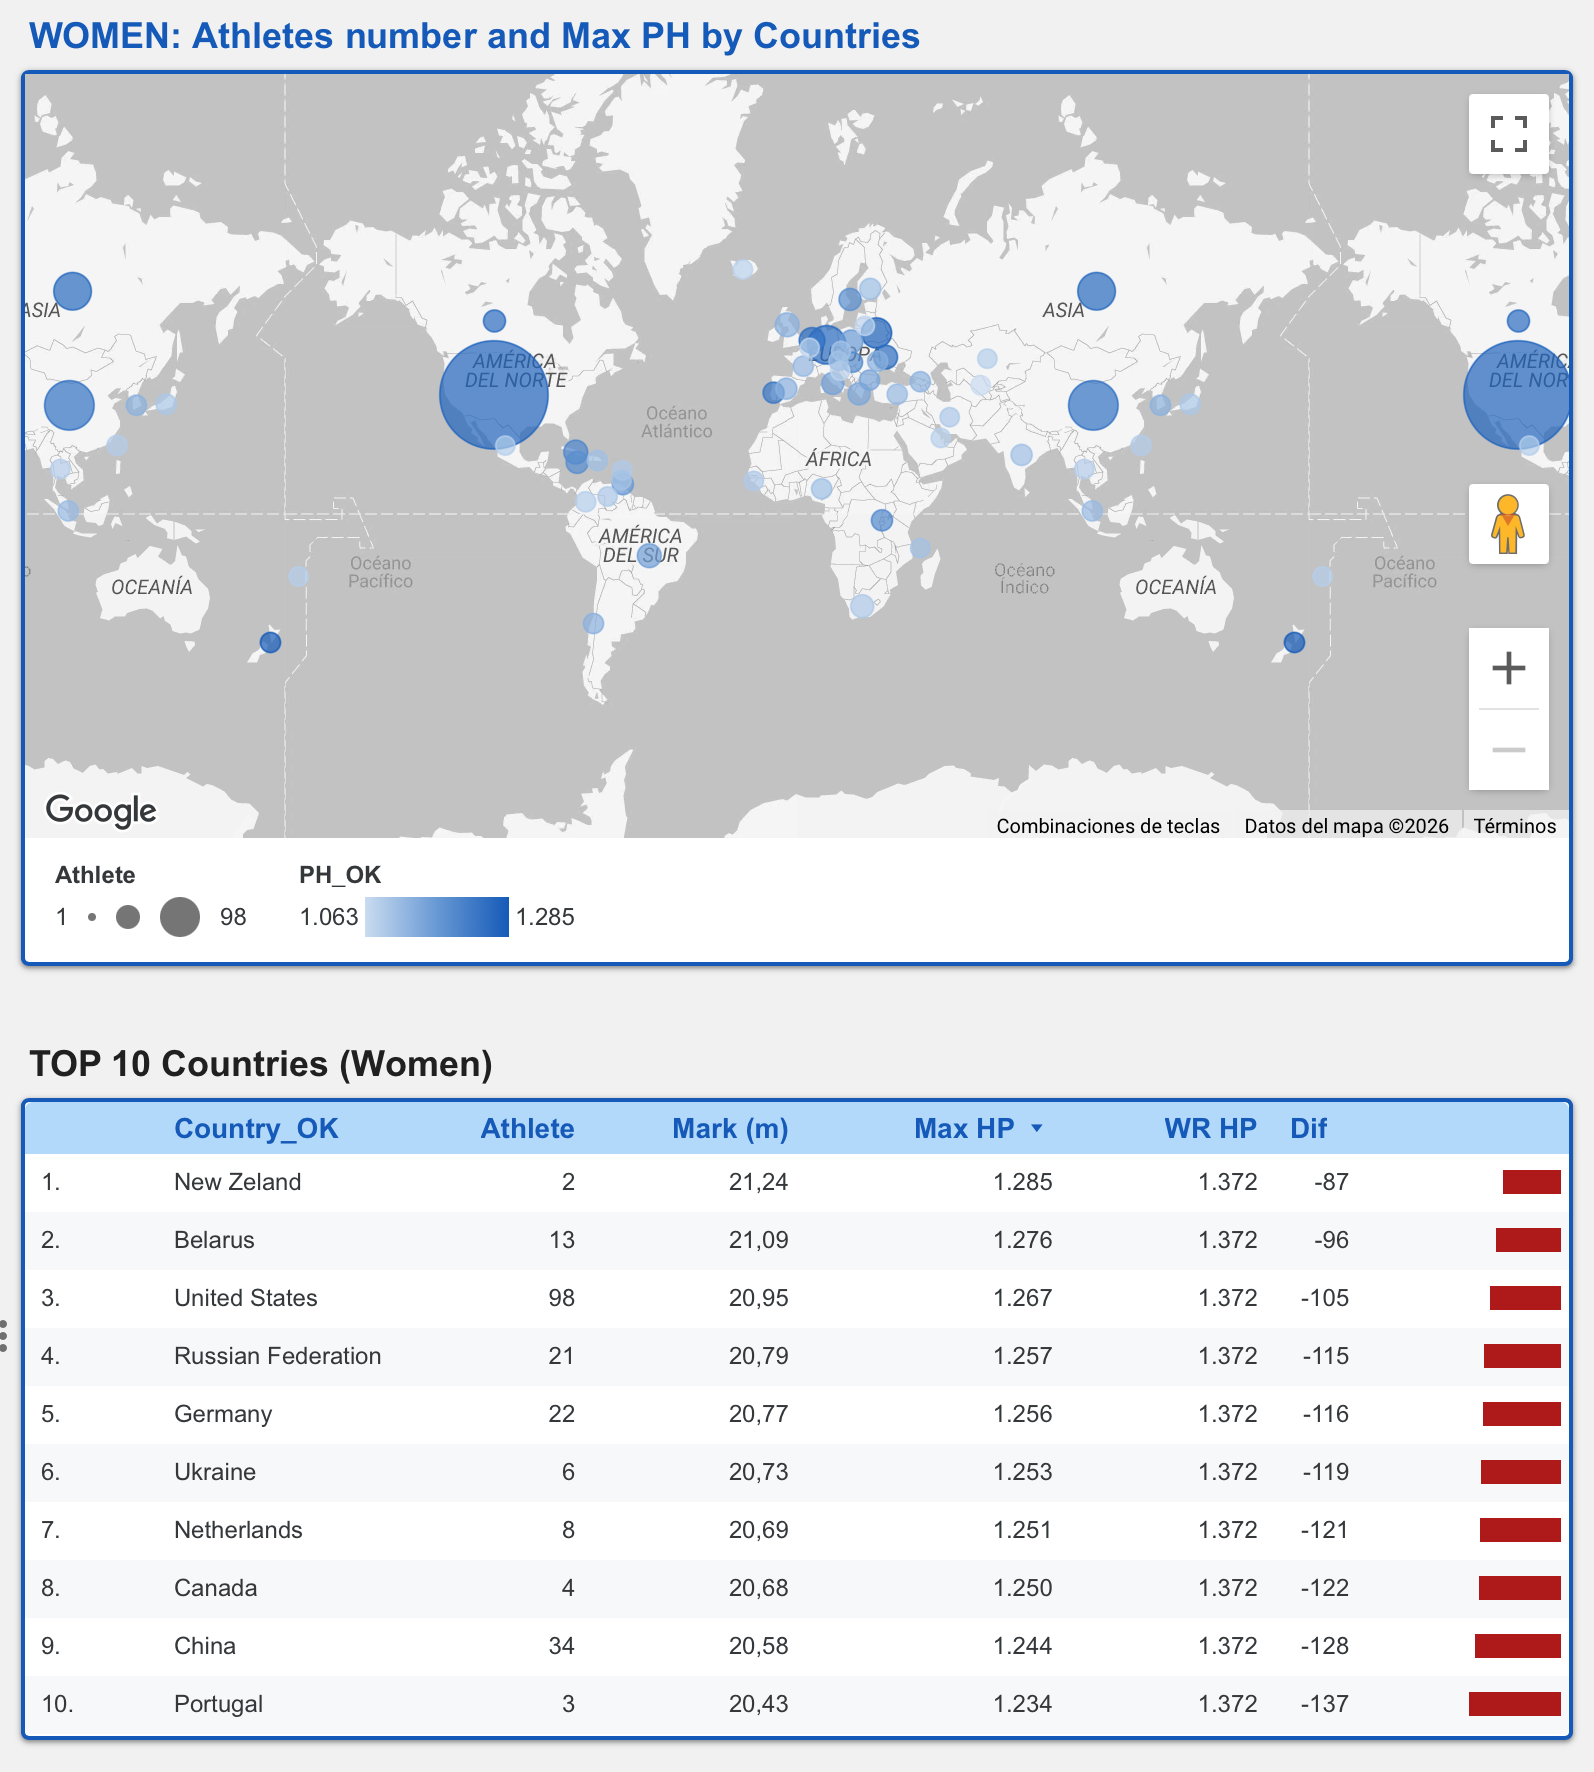
(Only the women’s section is shown in the image as an example)
Here, we present shot put performance by country, separately for women and men. The maps show the number of athletes within the study period (bubble size) and the highest Hungarian points score achieved (colour intensity).
The tables rank the top 10 countries, showing the number of athletes, best performance, and highest Hungarian points score. They also include the world record and the gap between each country’s best performance and the record, expressed in Hungarian points.
For women,
New Zealand has the best performance, despite having only two athletes. The United States shows clear dominance, with the third-best performance but 98 athletes over the study period.
For men, the United States is the clear leader, holding the world record and accounting for 155 athletes.
Please remember that you can filter these data using the dropdown controls above or by clicking on any of the charts.
Shot Put by ATHLETES
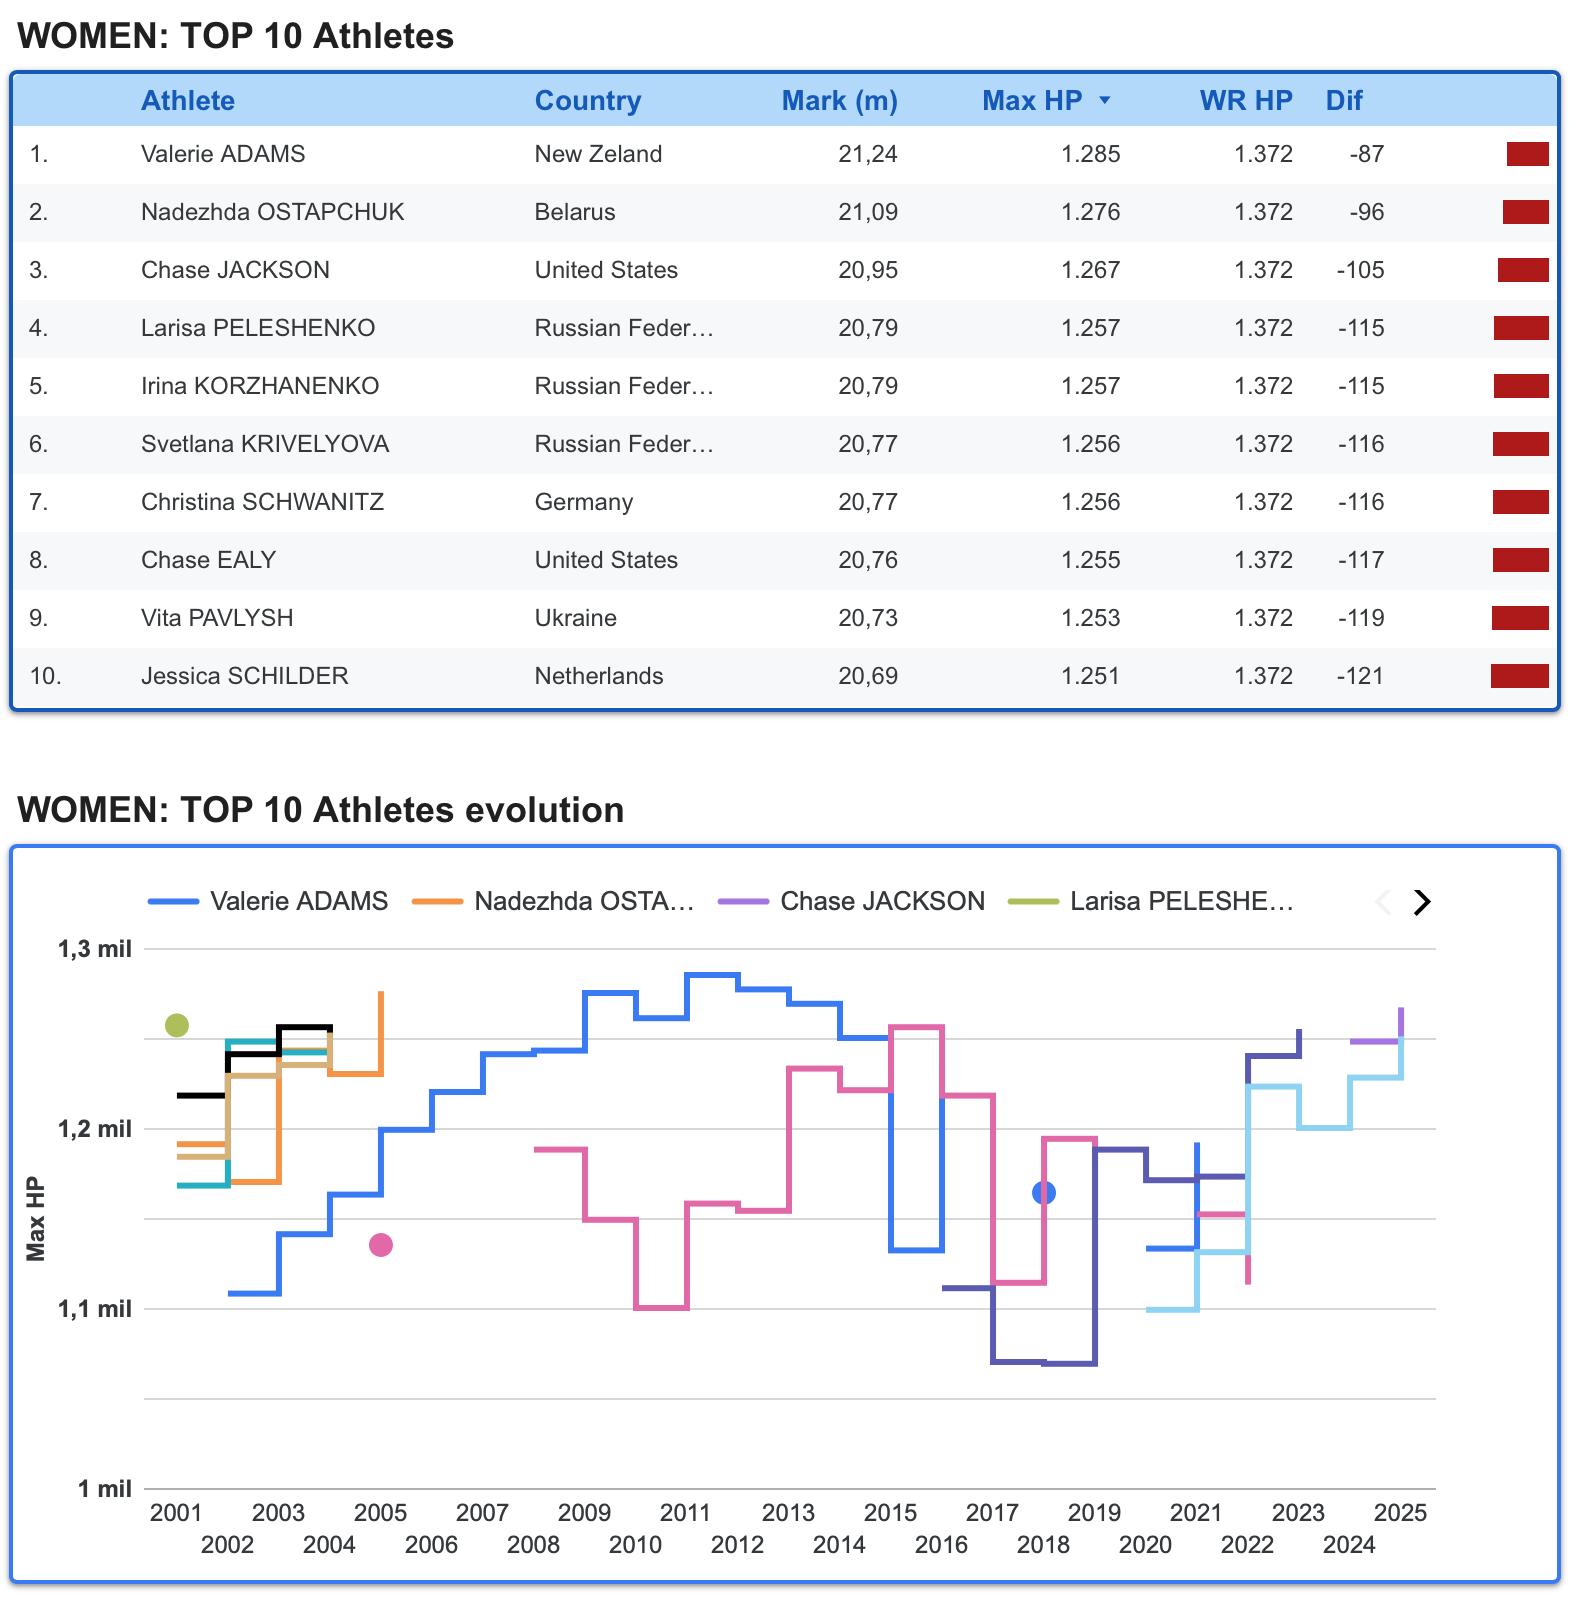
(Only the women’s section is shown in the image as an example)
Finally, we present the top 10 athletes, split into women’s and men’s rankings. The tables show each athlete’s performances, points score, and gap to the world record. The charts illustrate their progression over time, indicating the period during which each athlete remained above 1,100 points within the analysis period.
In the women’s category, Valerie Adams stands out for her long period of performances above 1,250 Hungarian points.
In the men’s category, Ryan Crouser’s dominance is undeniable, with performances above 1,300 points in recent years and his 2023 world record.
Please remember that you can filter these data using the dropdown controls above or by clicking on any of the charts.
INTERACTIVE REPORT
The report is embedded here for your convenience. In the shaded toolbar at the bottom of the report, you will find two links: one to open the report in full-screen mode and another to open it directly in Google Data Studio.
For greater flexibility, we recommend opening the report directly in Google Data Studio. It is safe and free to use.
Due to the complexity of the report, we recommend viewing it on a computer, or at least on a tablet.
(in case of use the embedded report, Click on the bottom-left navigation bar to move between the different pages of the report)
CONCLUSION
The data suggest that throwing events are not athletics’ “star” discipline, at least in terms of participation by athletes achieving more than 1,100 Hungarian points. This is even more evident in the women’s category, where fewer than 50 athletes exceed 1,100 points across all throwing events.
As for world records and top performances, many unfortunately belong to a darker past, marked by suspicions of unfair practices, including state-sponsored doping. There are clear exceptions, which can be explored in the report.
On a positive note, and as a source of hope for the future, we can see progress in the men’s hammer throw, women’s discus and hammer throw, and, most notably, the men’s javelin throw.
That’s all for now. We will soon continue with the jumps disciplines.. Please notify me any mistake or suggestion about how to improve our analysis.
Any comments or suggestions are very welcome.
Thank you for your attention.
