
WOMEN’S HEPTATHLON IN EUROPE: 25 YEARS STATISTIC ANALYSIS
Continuing the analysis of combined events in Europe over the past 25 years, we now turn to the women’s heptathlon.
Following the structure of the men’s decathlon analysis, the aim is to examine the evolution and results of the heptathlon, including the contribution of each event to the overall result.
The raw data used in this analysis has been collected from the World Athletics scoring tables and has been carefully prepared to ensure accurate and meaningful results.
OVERVIEW
OBJETIVE OF THE ANALYSIS
We aim to provide an overview of the evolution of the women’s heptathlon in Europe, highlighting its key contributors—countries and athletes—and the relative weight of each combined event in the final result.
DATA DESCRIPTION
The data correspond to the top 10 athletes in the European ranking for each year. It includes total performances (Mark), Hungarian scoring points (Result), and event-by-event results, both in actual performances and in Hungarian points. Athletes’ personal bests, expressed in Hungarian points, have also been included.
To better segment the information, the following variables have been included: the athlete’s country, the competition venue, and the current population of each country, in order to derive certain ratios.
INTERACTIVE REPORTS
Each section includes interactive reports created in Google Datastudio, allowing users to segment, filter, and compare the presented data. While we believe the reports are fairly intuitive to use, we provide below a brief guide to help you get started. Please feel free to interact with the reports; however, if you have any questions, you are welcome to leave a comment or contact us by email.
(Please note that, although the system adapts to the device format, mobile viewing is recommended in landscape mode to avoid losing detail)
To access each report, please click on the image shown. A new window will open with the selected report page.
For a better experience, we recommend viewing this on a desktop or tablet.
HEPTATHLON RESULTS
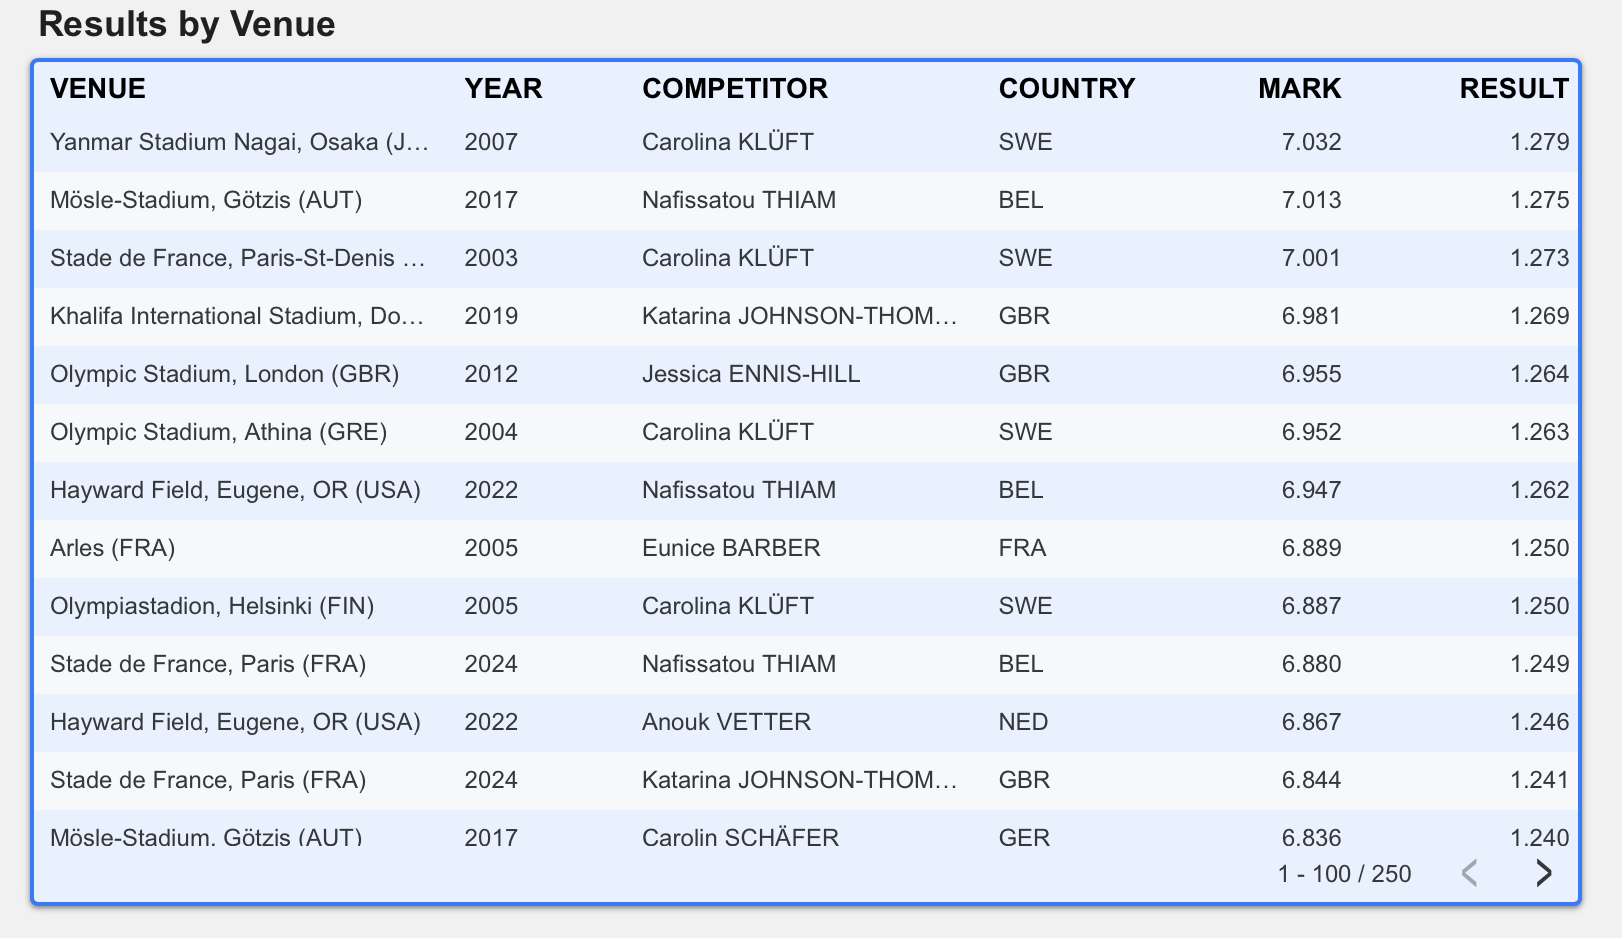
To begin, let us look at the Heptathlon results over the past 25 years.
The best performances were achieved by Carolina Klüft with 7,032 points in 2007, followed by the Belgian athlete Nafissatou Thiam with 7,013 points in 2017. These are the only athletes to have surpassed the 7,000-point barrier.
In third place, we find Katarina Johnson-Thompson, with 6,981 points achieved in 2019.
The official ranking from World Athletics can be consulted here.
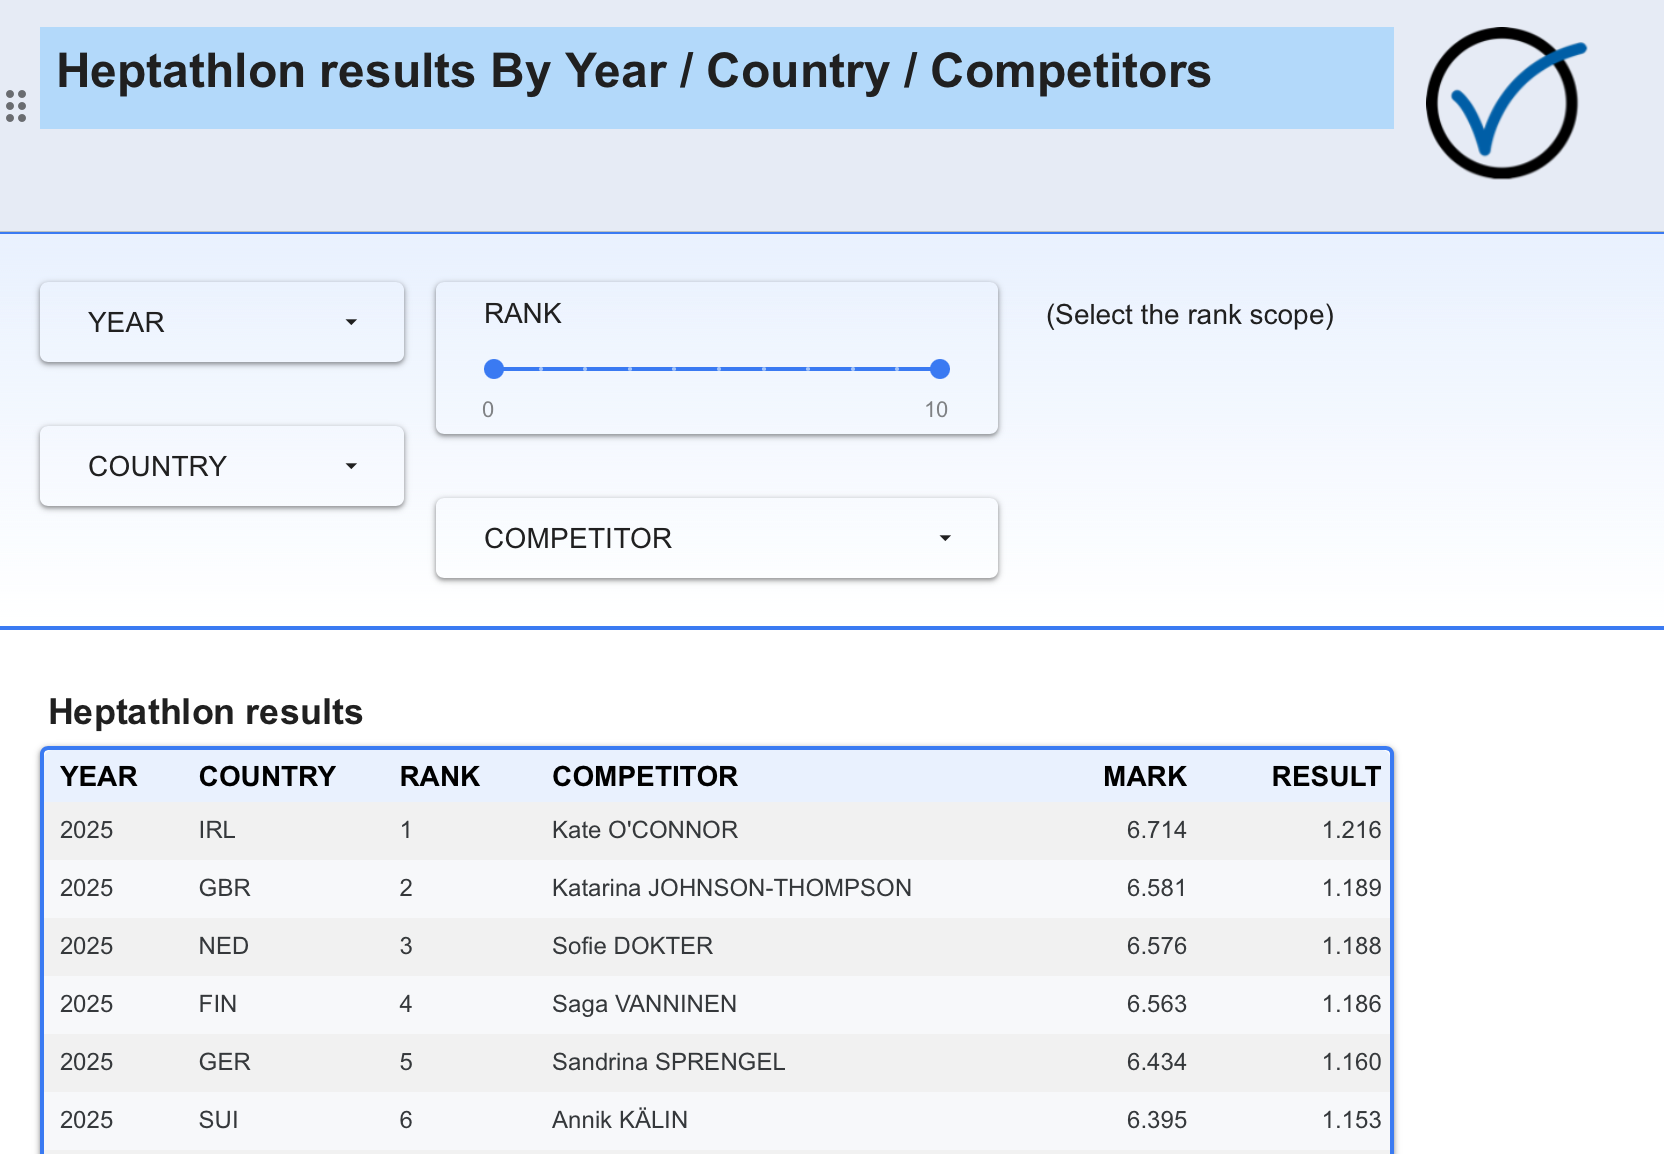
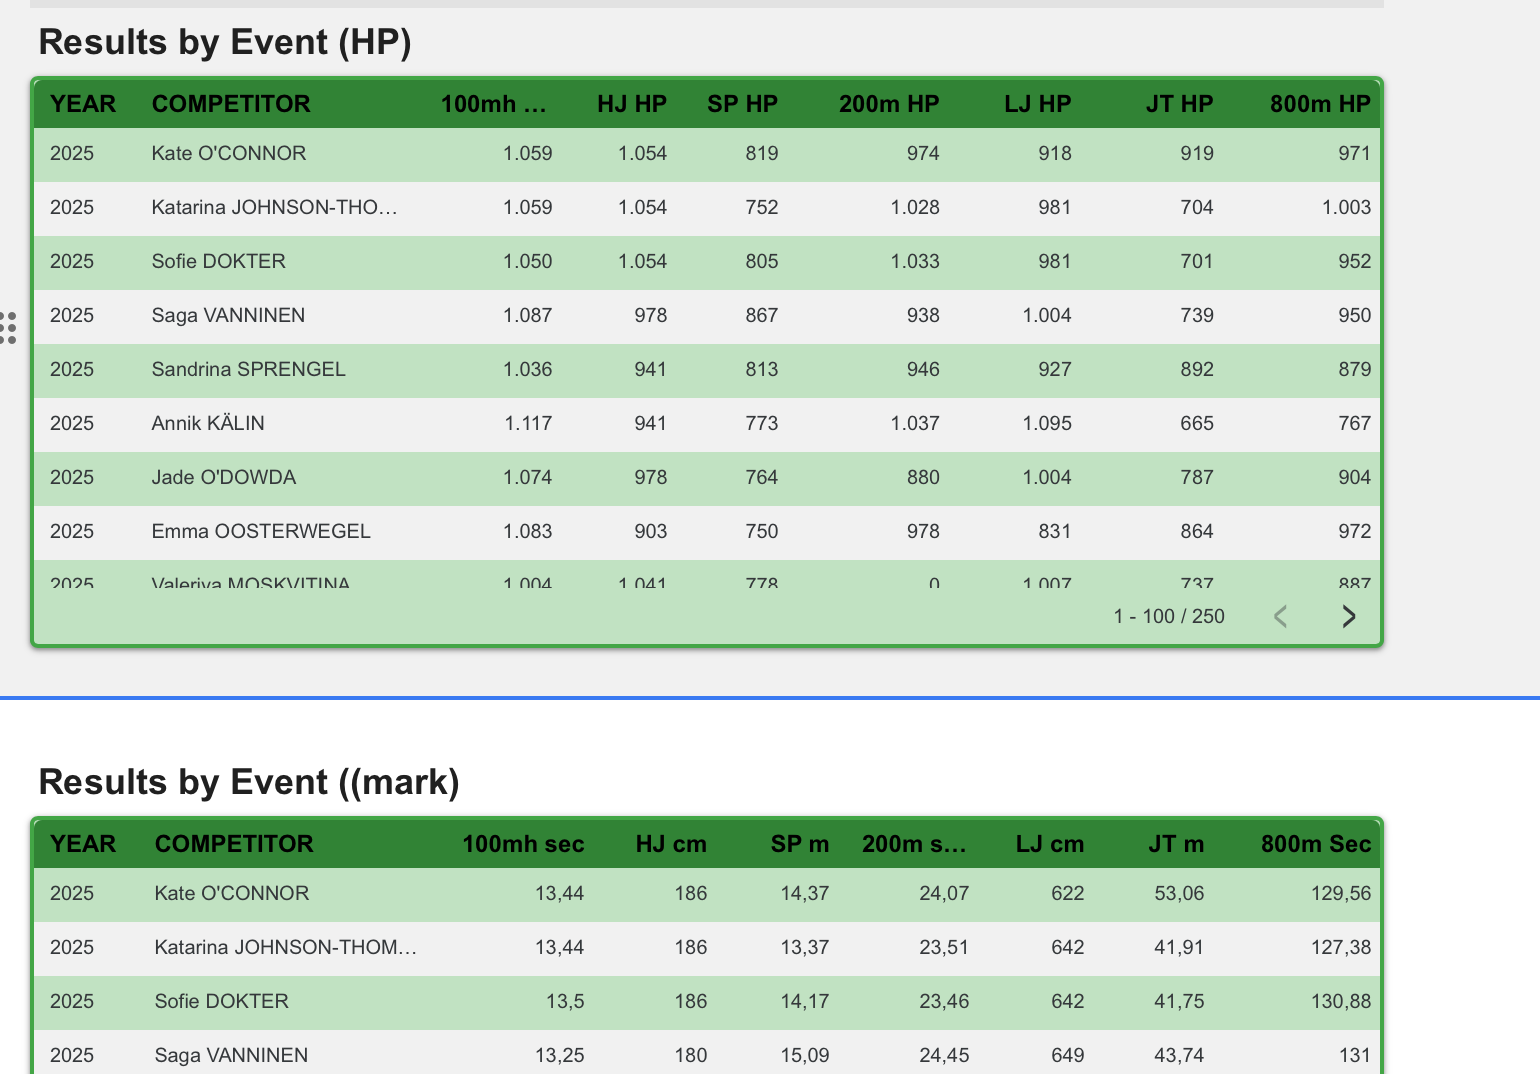
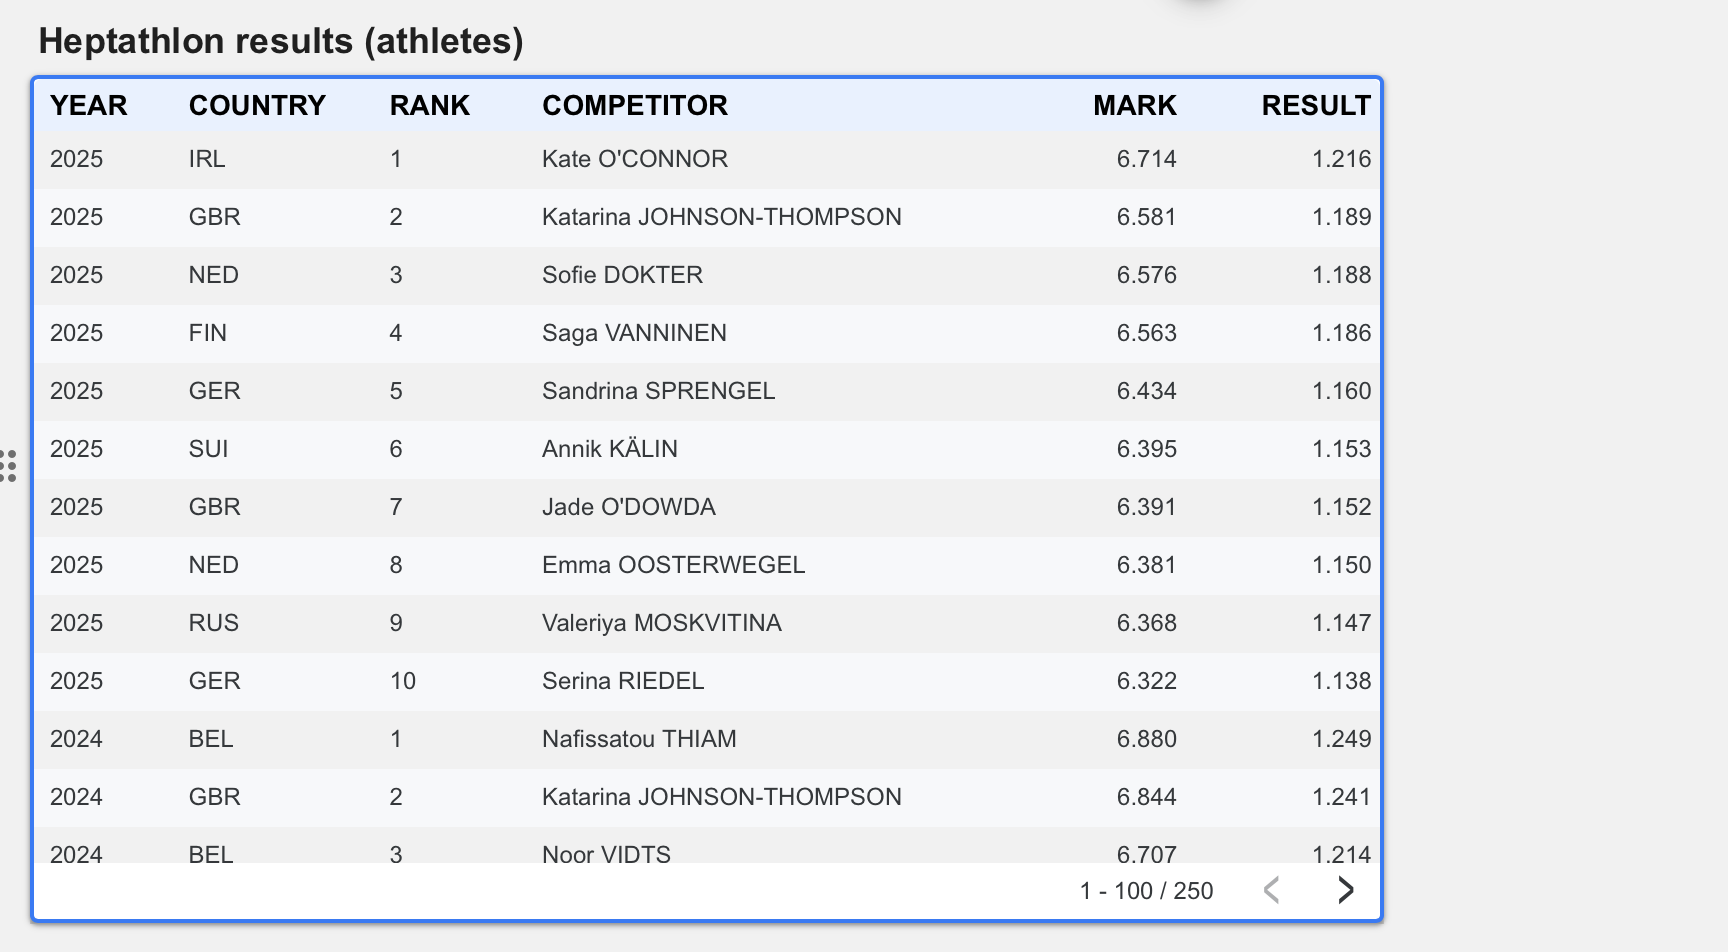
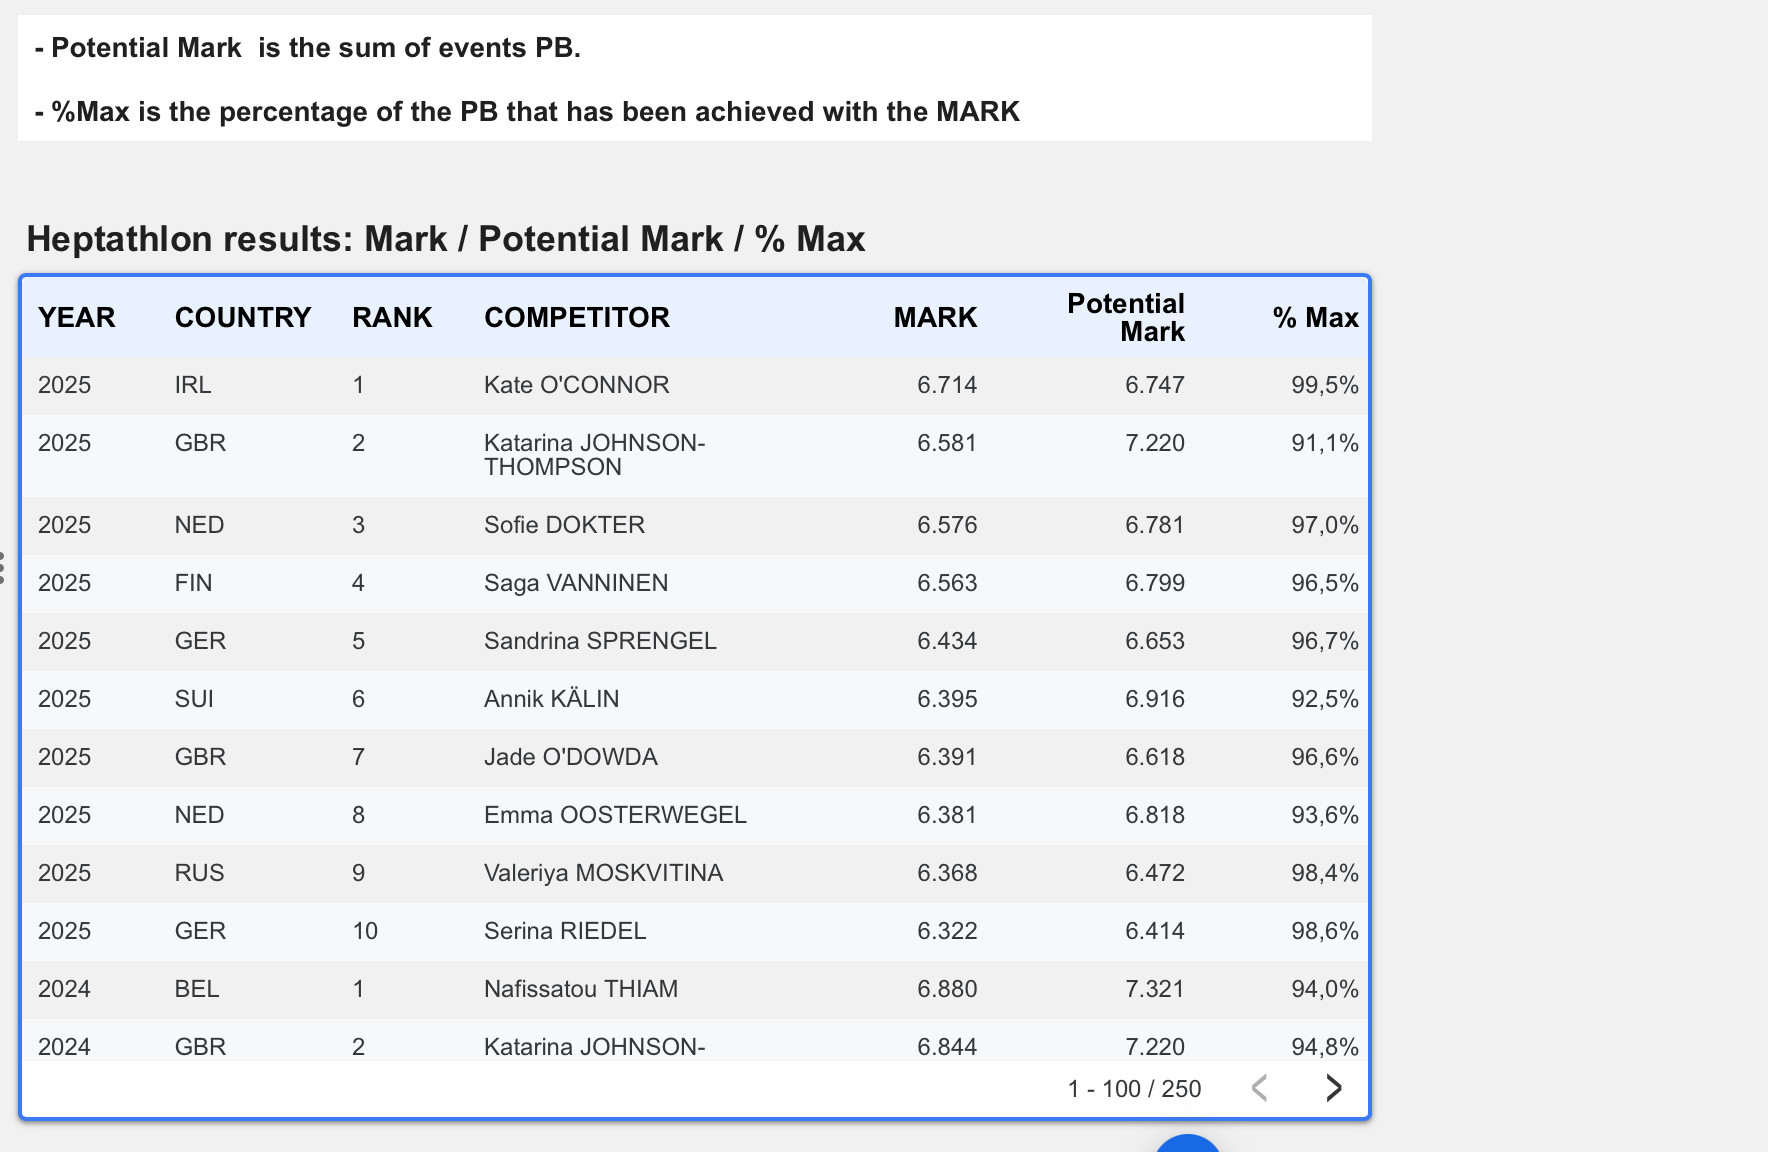
Report page 1: Results
On the first page, the results from the 25-year period are presented, together with their conversion into Hungarian points, as well as two additional tables showing the event-by-event breakdown in both actual performances and Hungarian points.
The dropdown controls allow users to filter by year, country, athlete, and also by ranking positions from 1 to 10 for each year.
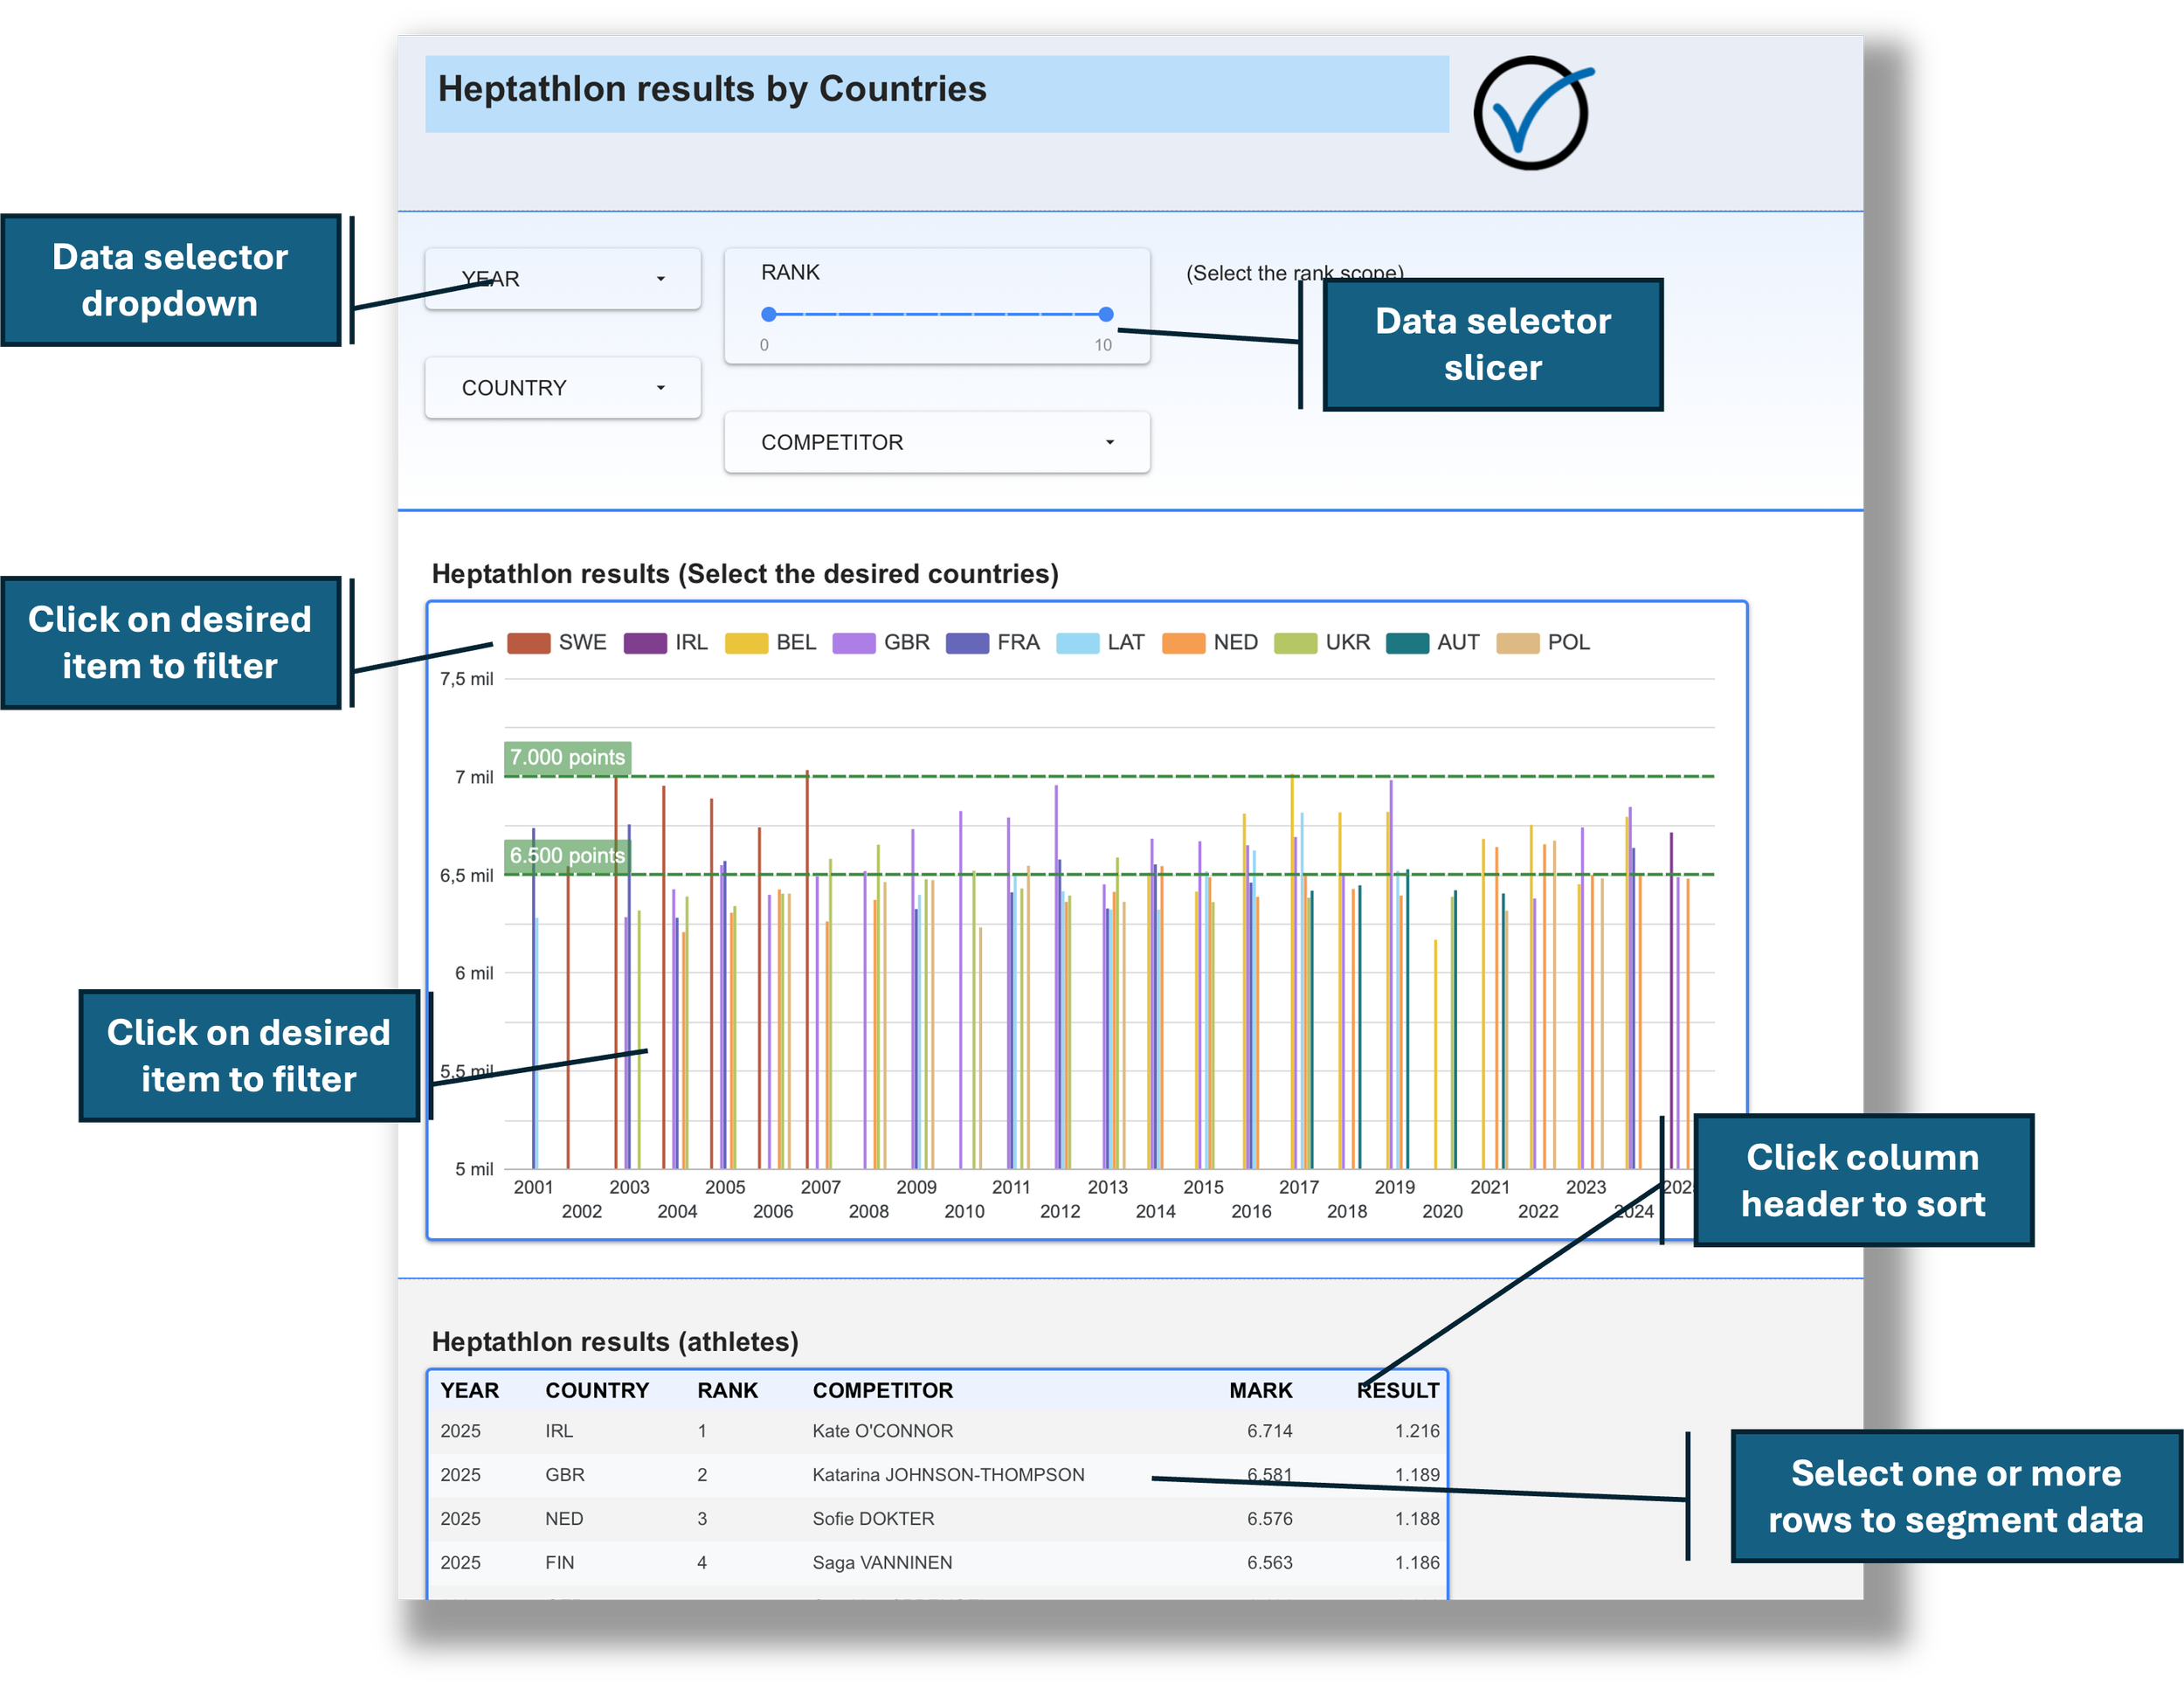
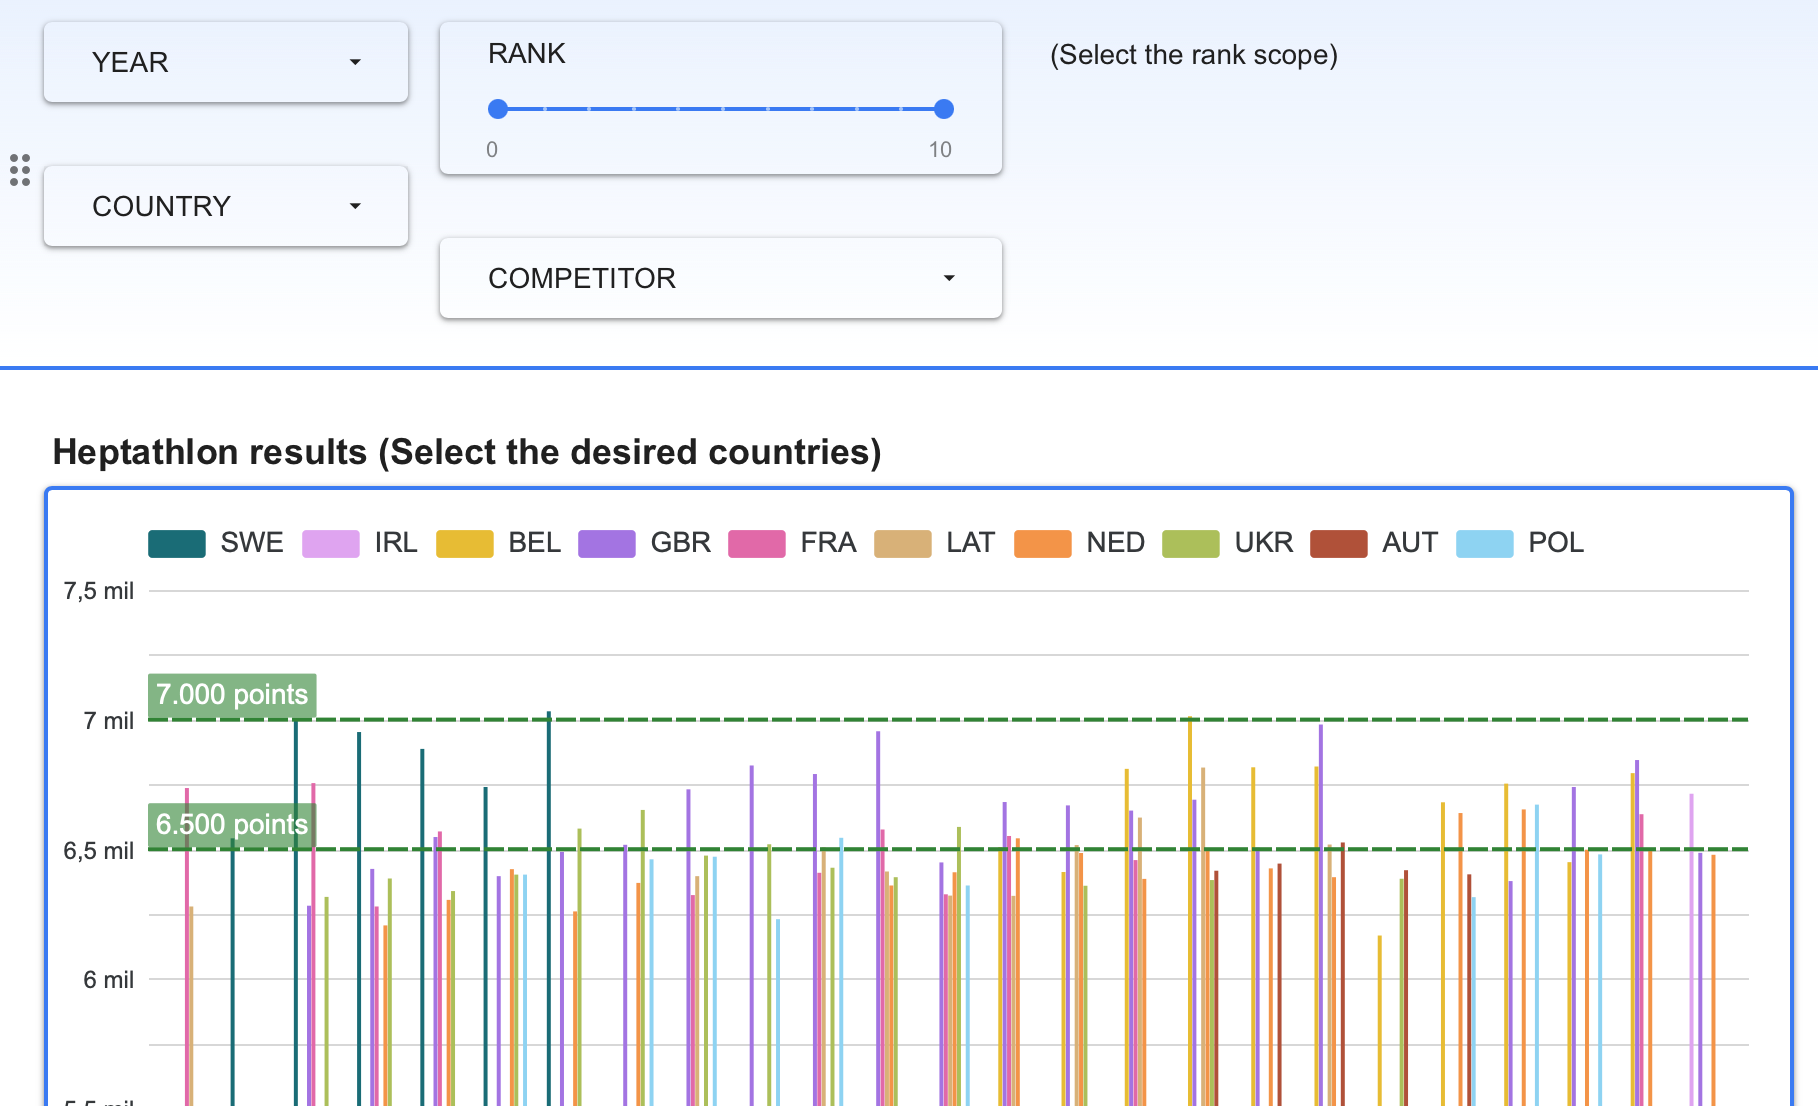
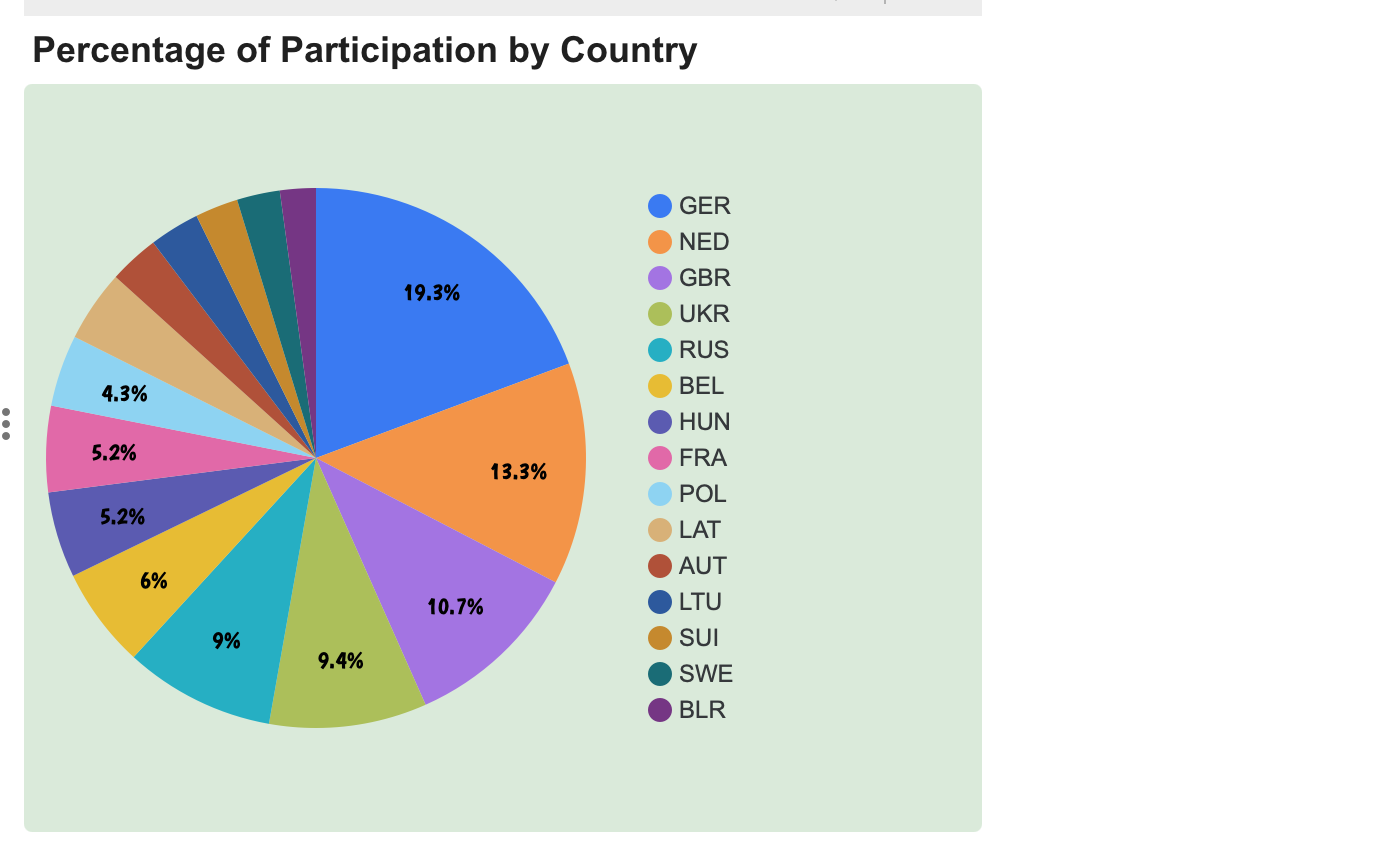
Report page 2: Results by year / country
On the second page of the report, the chart displays the annual evolution of the selected country or countries, based on the corresponding control. Users can also filter by year and refine ranking positions. The table below lists the results, while the pie chart shows the percentage of representatives by country within the selected range.
Click on the gallery to access the report (opening in a new tab)
ATHLETES: RESULTS & PERFORMANCE
The following report presents and compares results with a focus on athletes, including their personal best performances overall and in each event, in order to assess their performance in each competition.
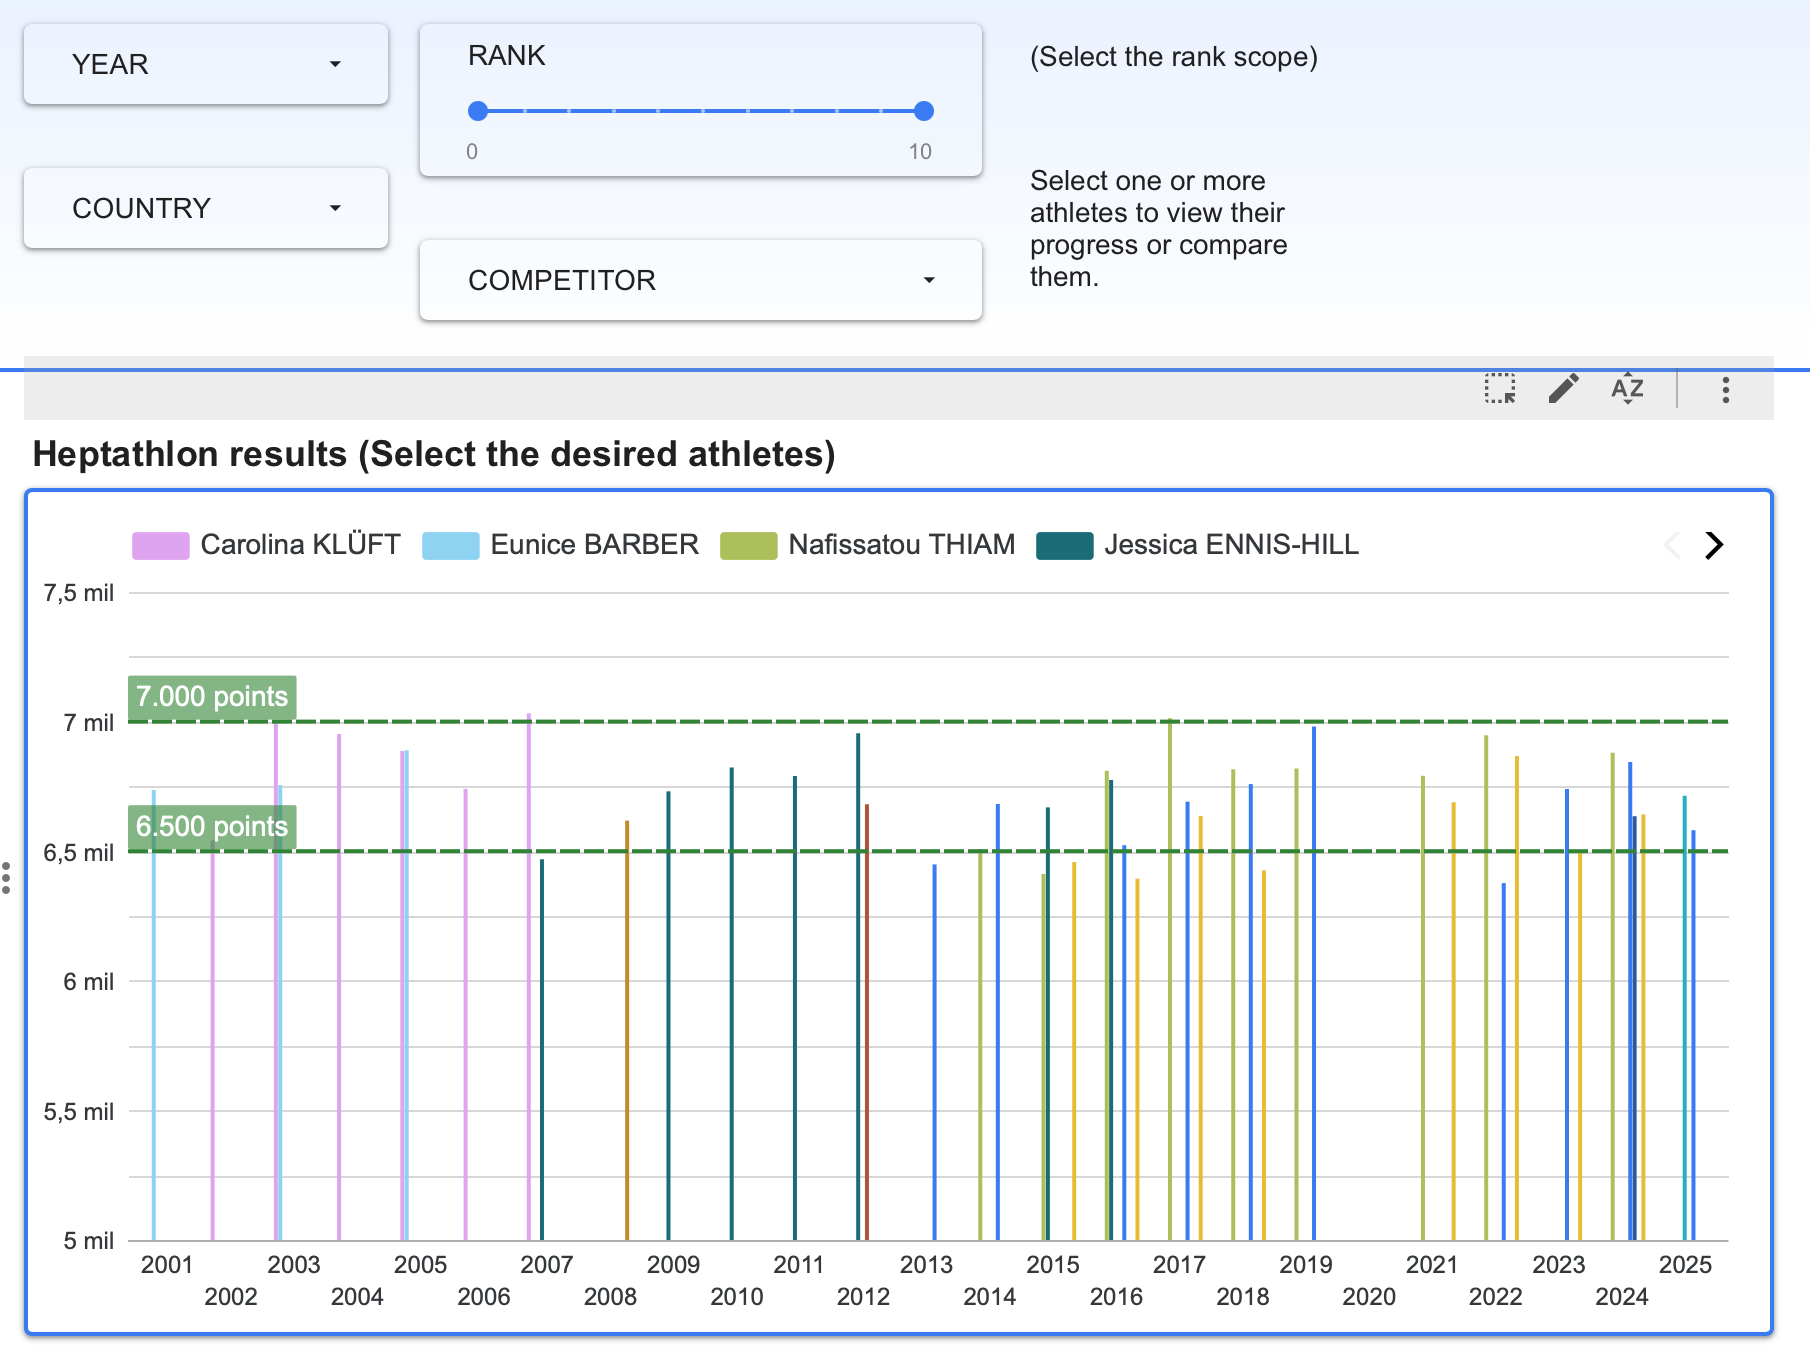
Report page 3: Athletes evolution
Once the desired filters have been applied using the dropdowns, the chart displays the year-by-year progression of athletes and their performances, allowing users to track their development and compare results.
The table below shows, for each year and athlete, the performance, their potential performance—derived from the sum of their personal bests across all events—and the % Max, which represents the ratio between actual and potential performance, providing an indication of the athlete’s efficiency in each competition.
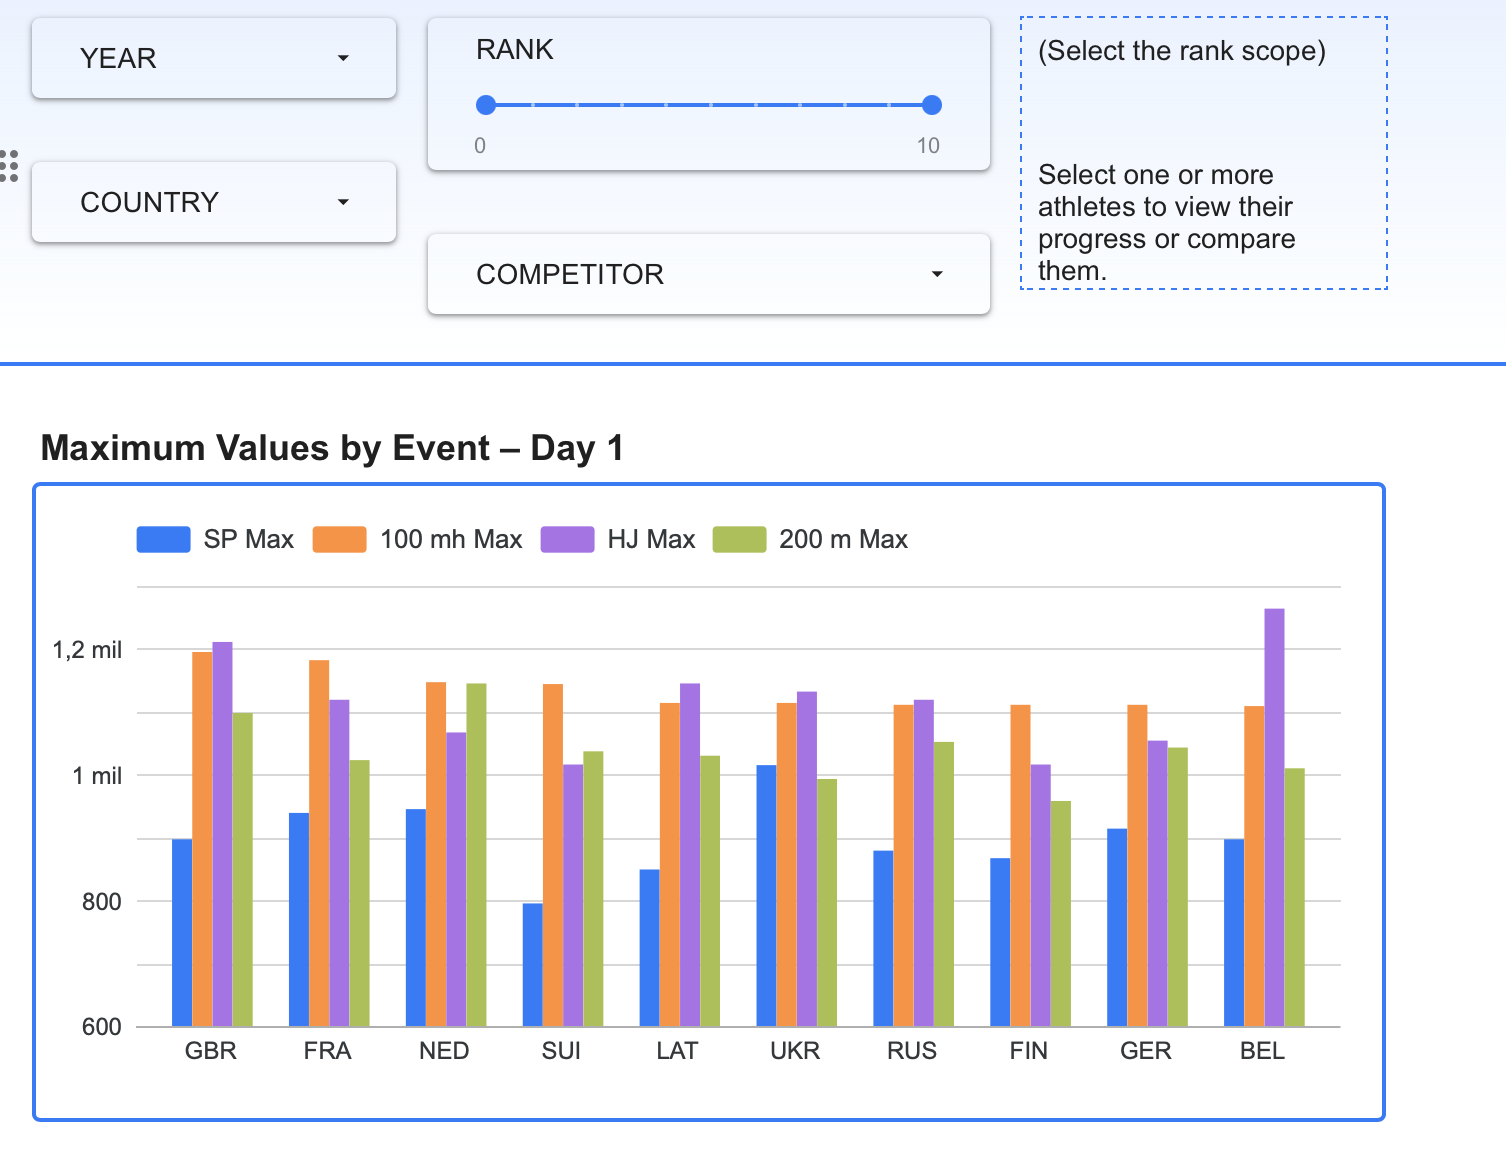
Report Page 4: Events by Countries / Athletes
Here, we present the best performances by country for each event, displayed in two bar charts corresponding to the two traditional competition days.
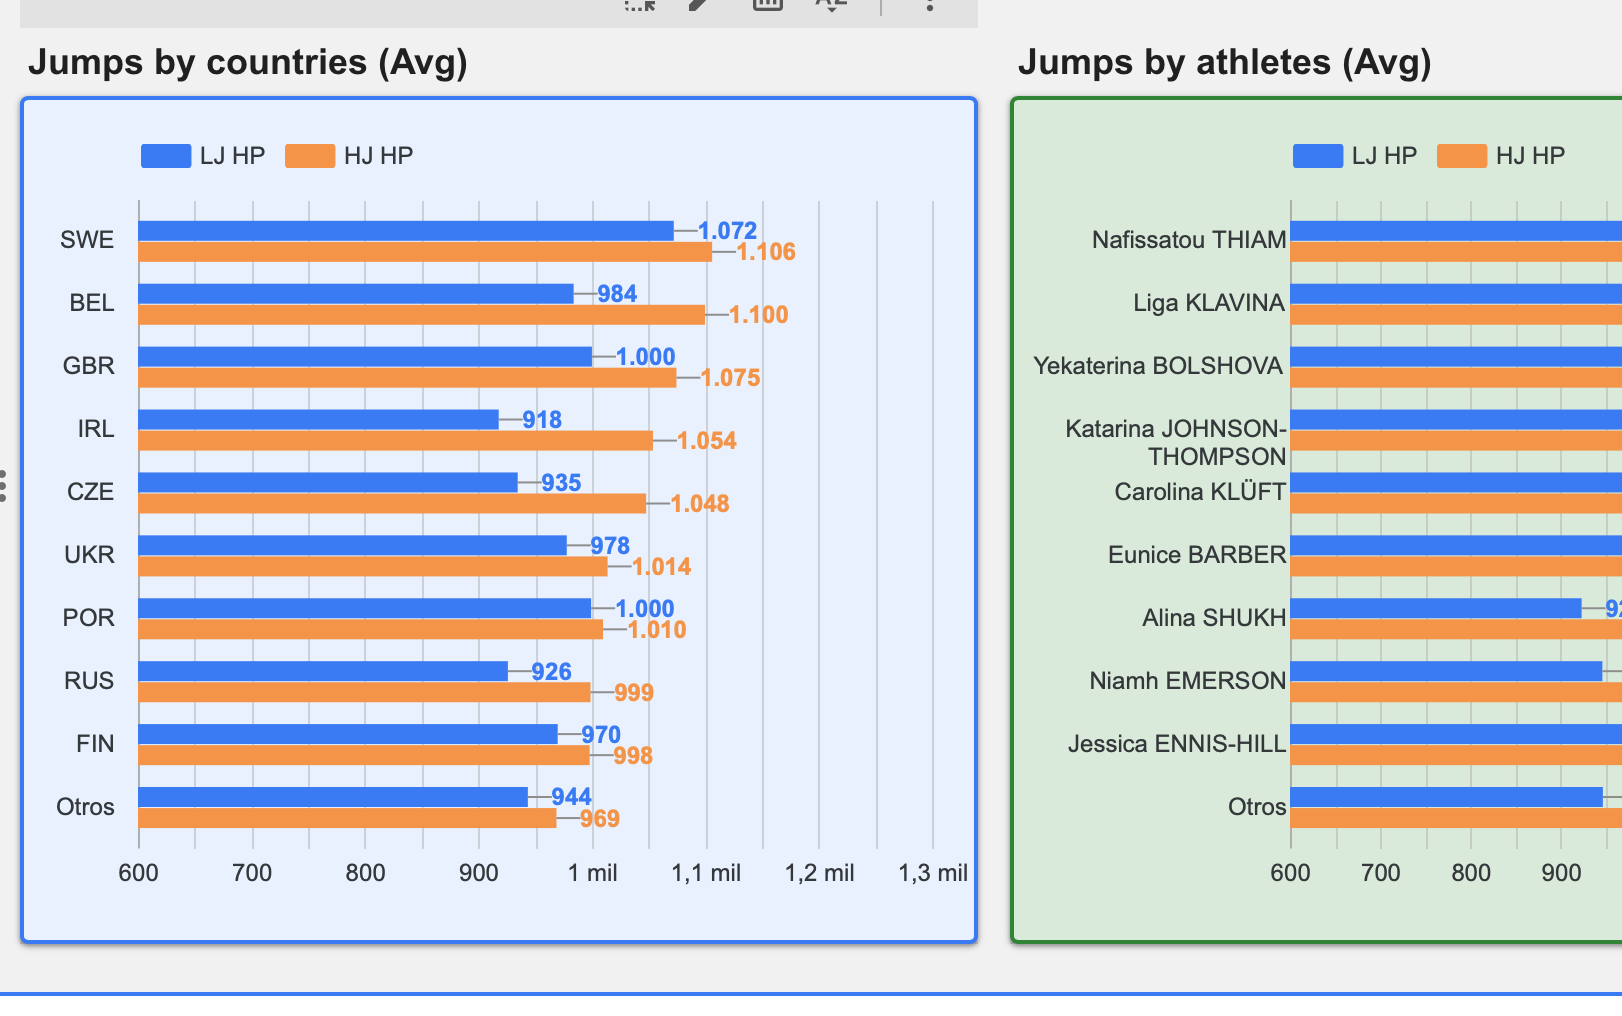
Below, we present the average event results by athlete, grouped into jumps, throws, running events, and hurdles.
The dropdown controls allow users to select countries, athletes, years, and ranking ranges.
Click on the gallery to access the report (opening in a new tab)
HEPTATHLON MAP
In this section, we analyze results across different competition venues, as well as the impact of the decathlon in each country, considering its population and number of participants.
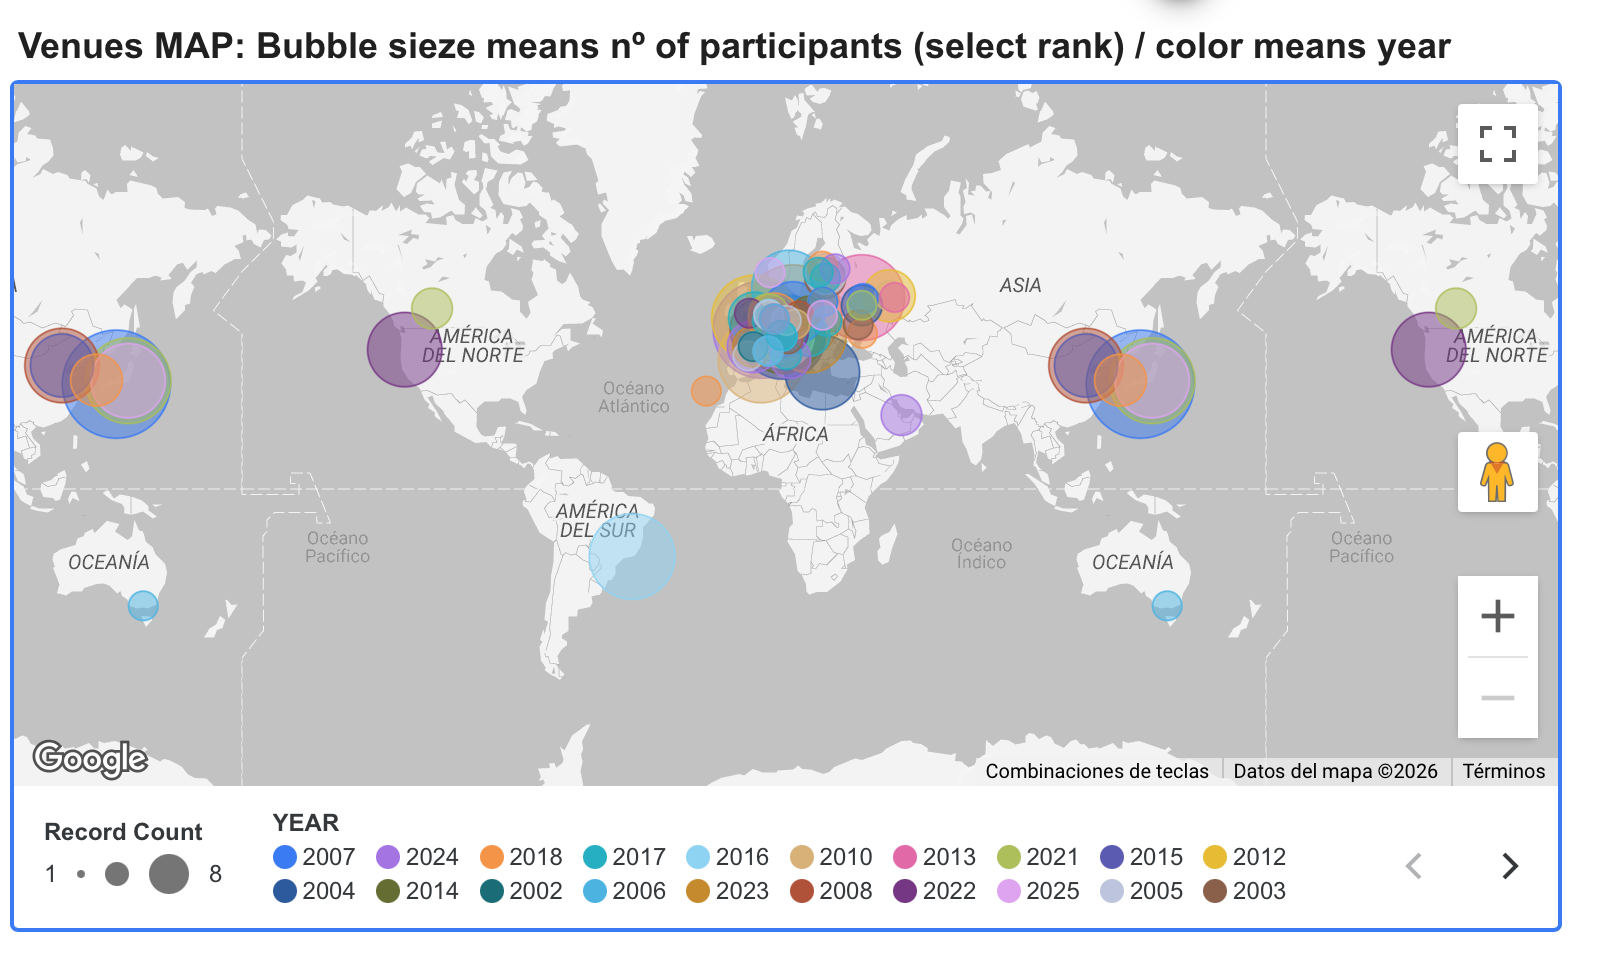
Report page 5: Heptathlon venues map
This page displays a map with the different event locations. The size of the bubbles represents the number of European participants within the selected range, while the color of each bubble indicates the year of the event.
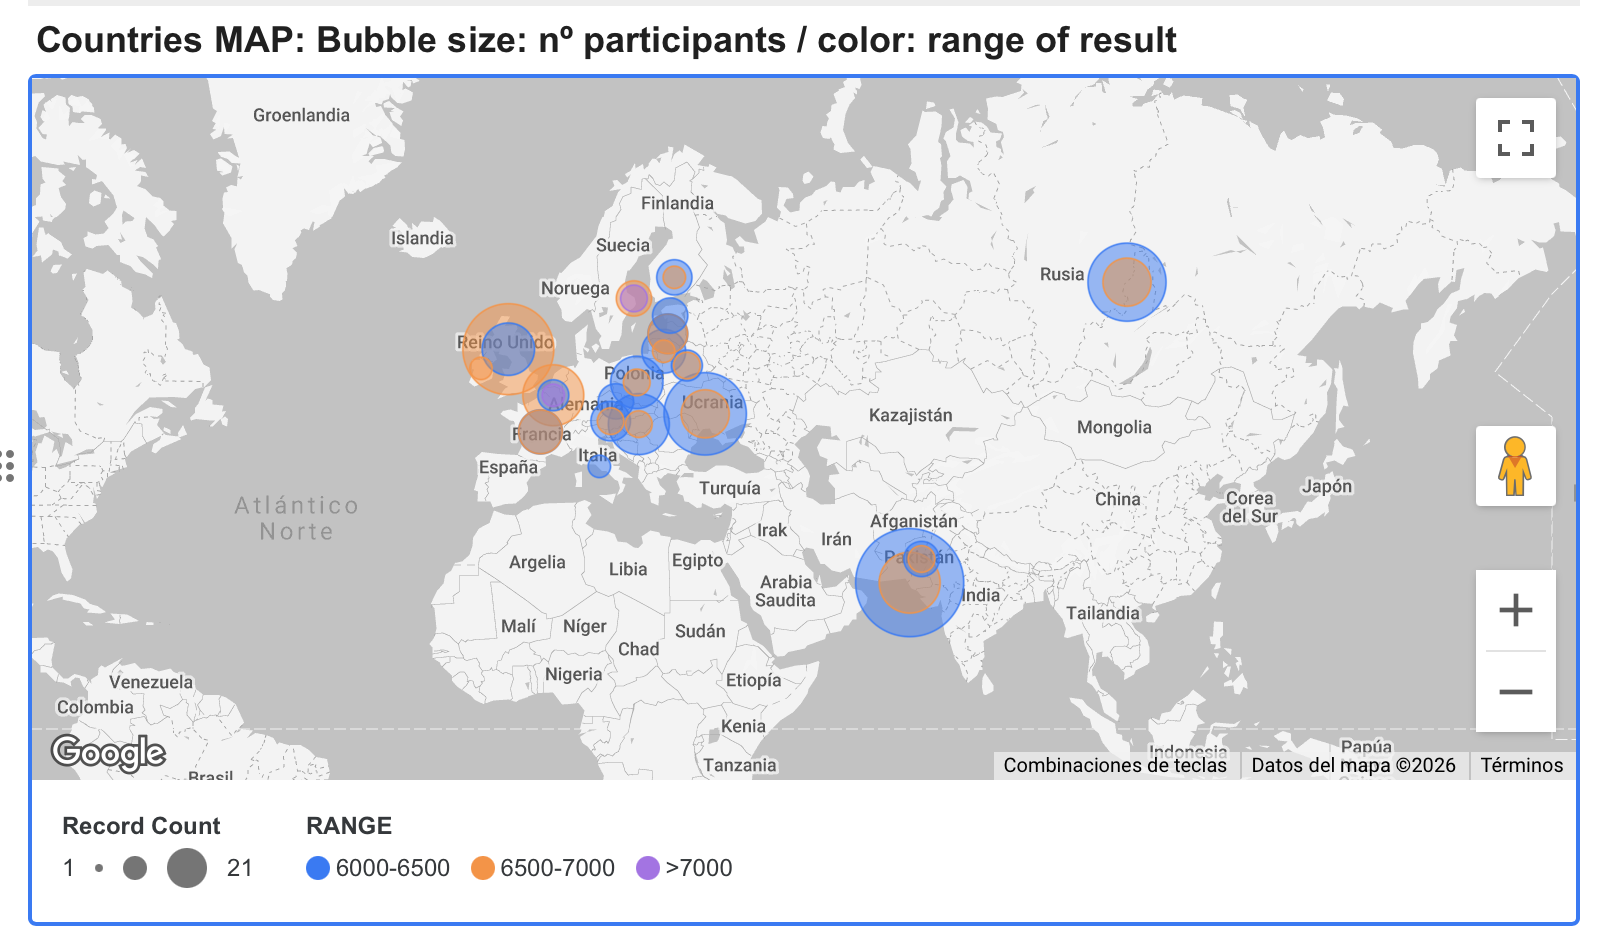
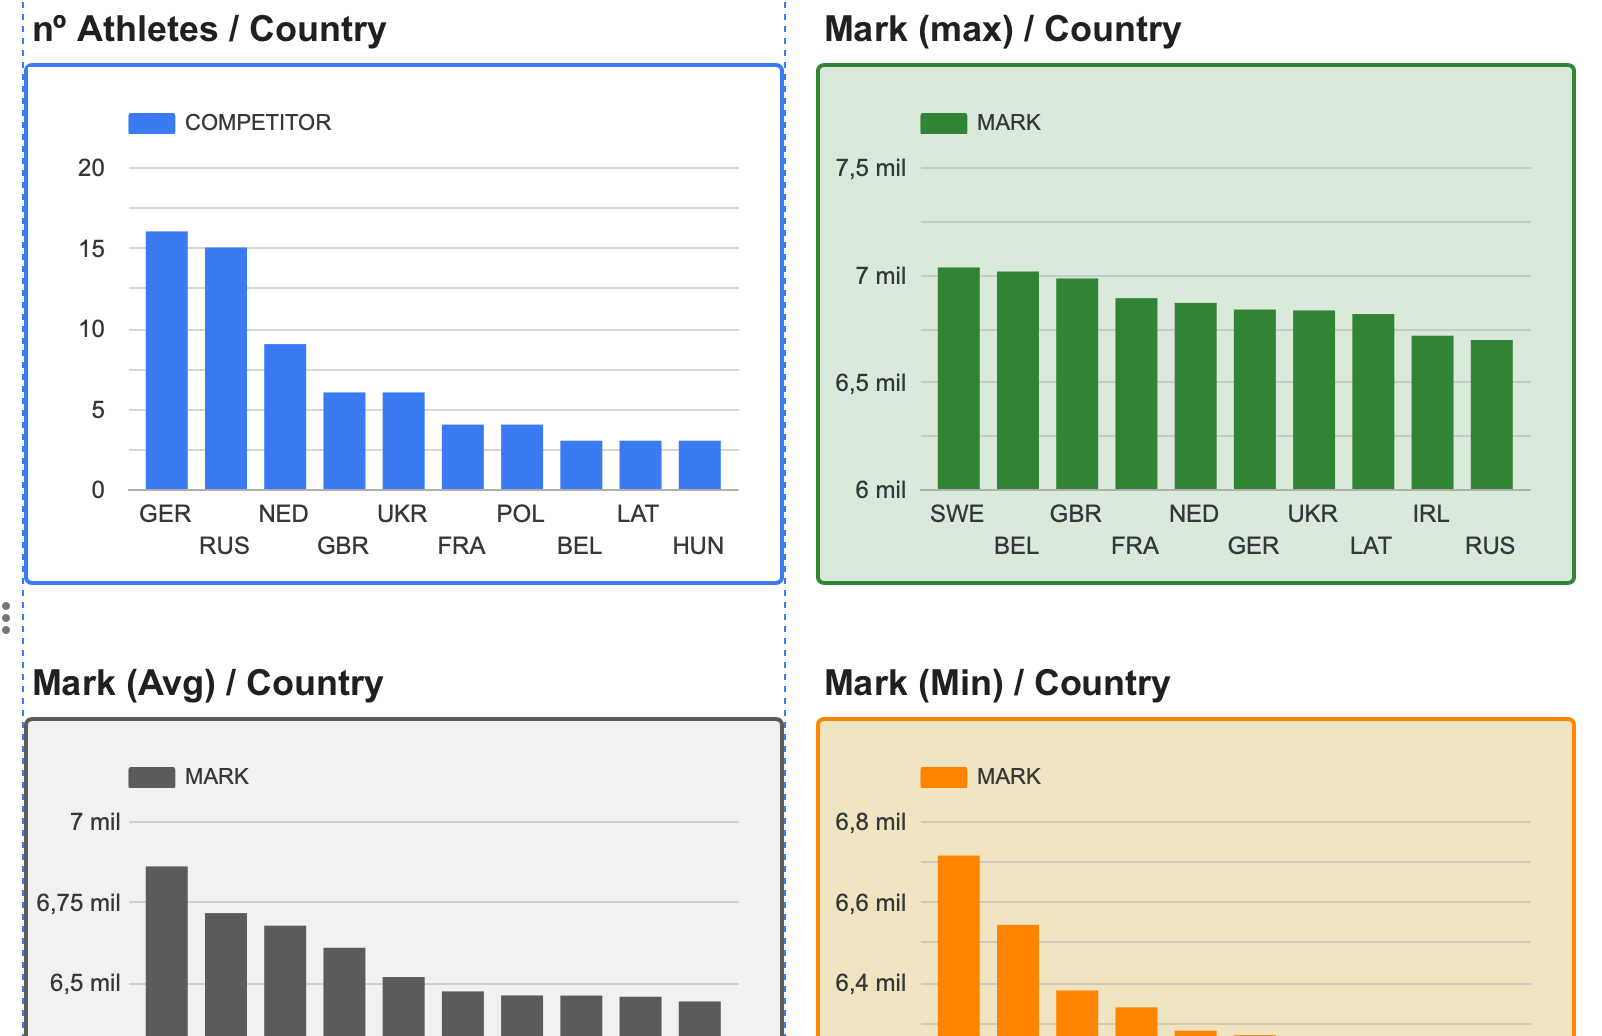
Report page 6: Heptathlon map: Countries
On page 6, we present a map with the countries, where the color of the bubbles reflects the range of average score, while their size represents de number of athletes. Users can also filter by year and refine the ranking range from 1 to 10 using the slider control.
Further below, charts display the number of athletes by country, as well as the maximum, average, and minimum results achieved.
Click on the gallery to access the report (opening in a new tab)
Events Analysis
Finally, we analyze the individual heptathlon events, the performances achieved, the evolution of athletes, and the impact of each event on the overall result by country.
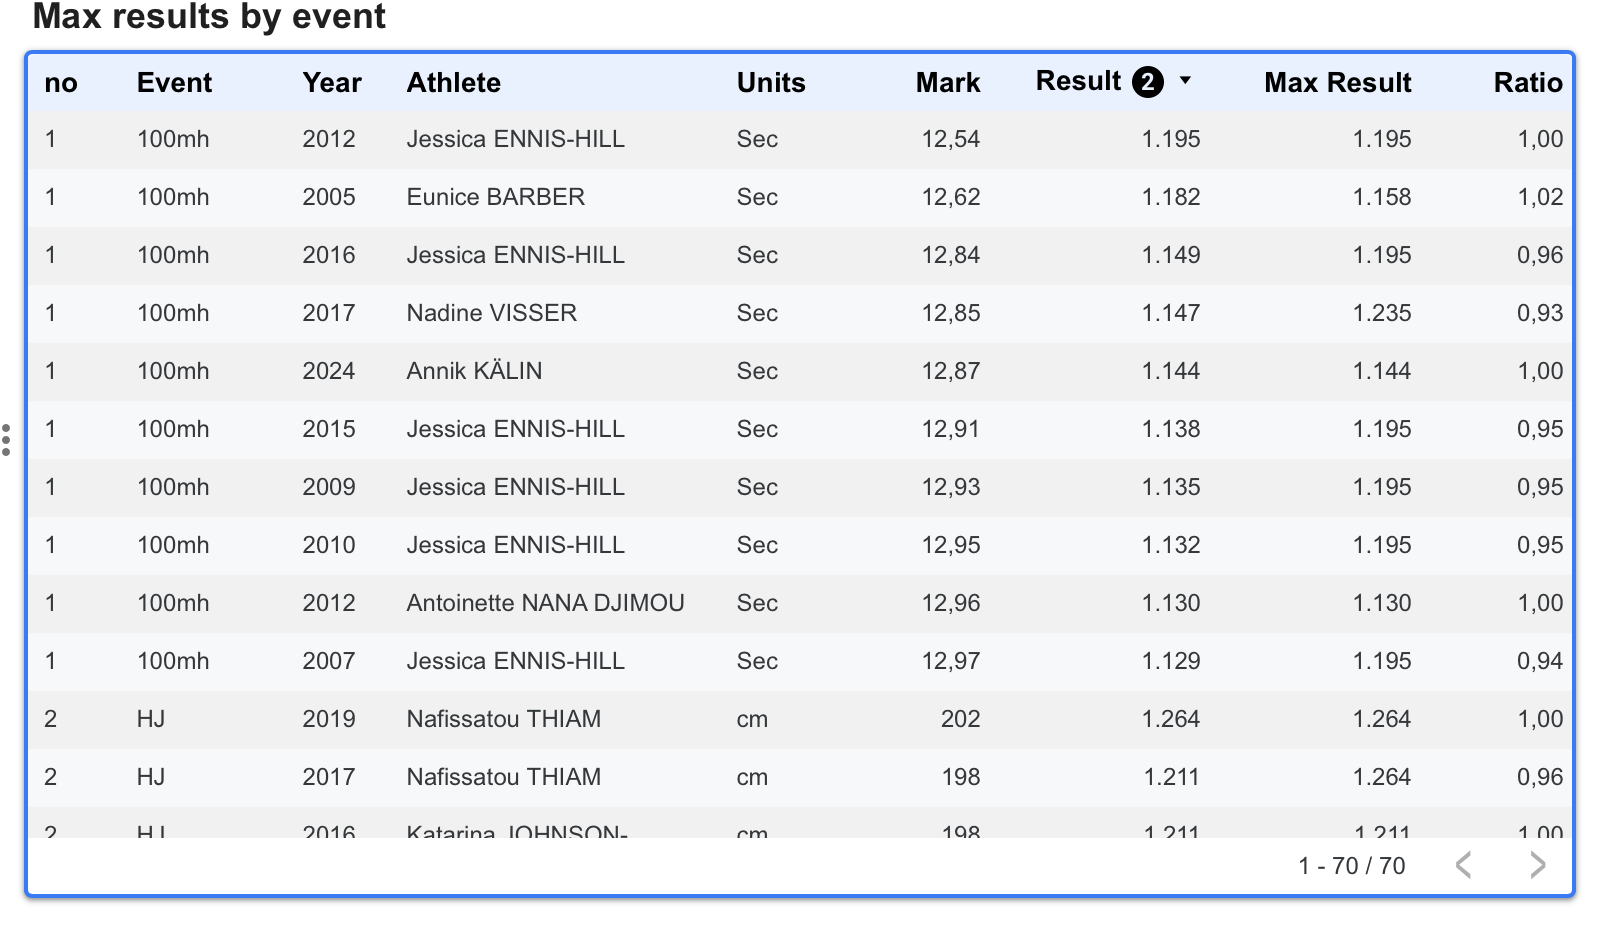
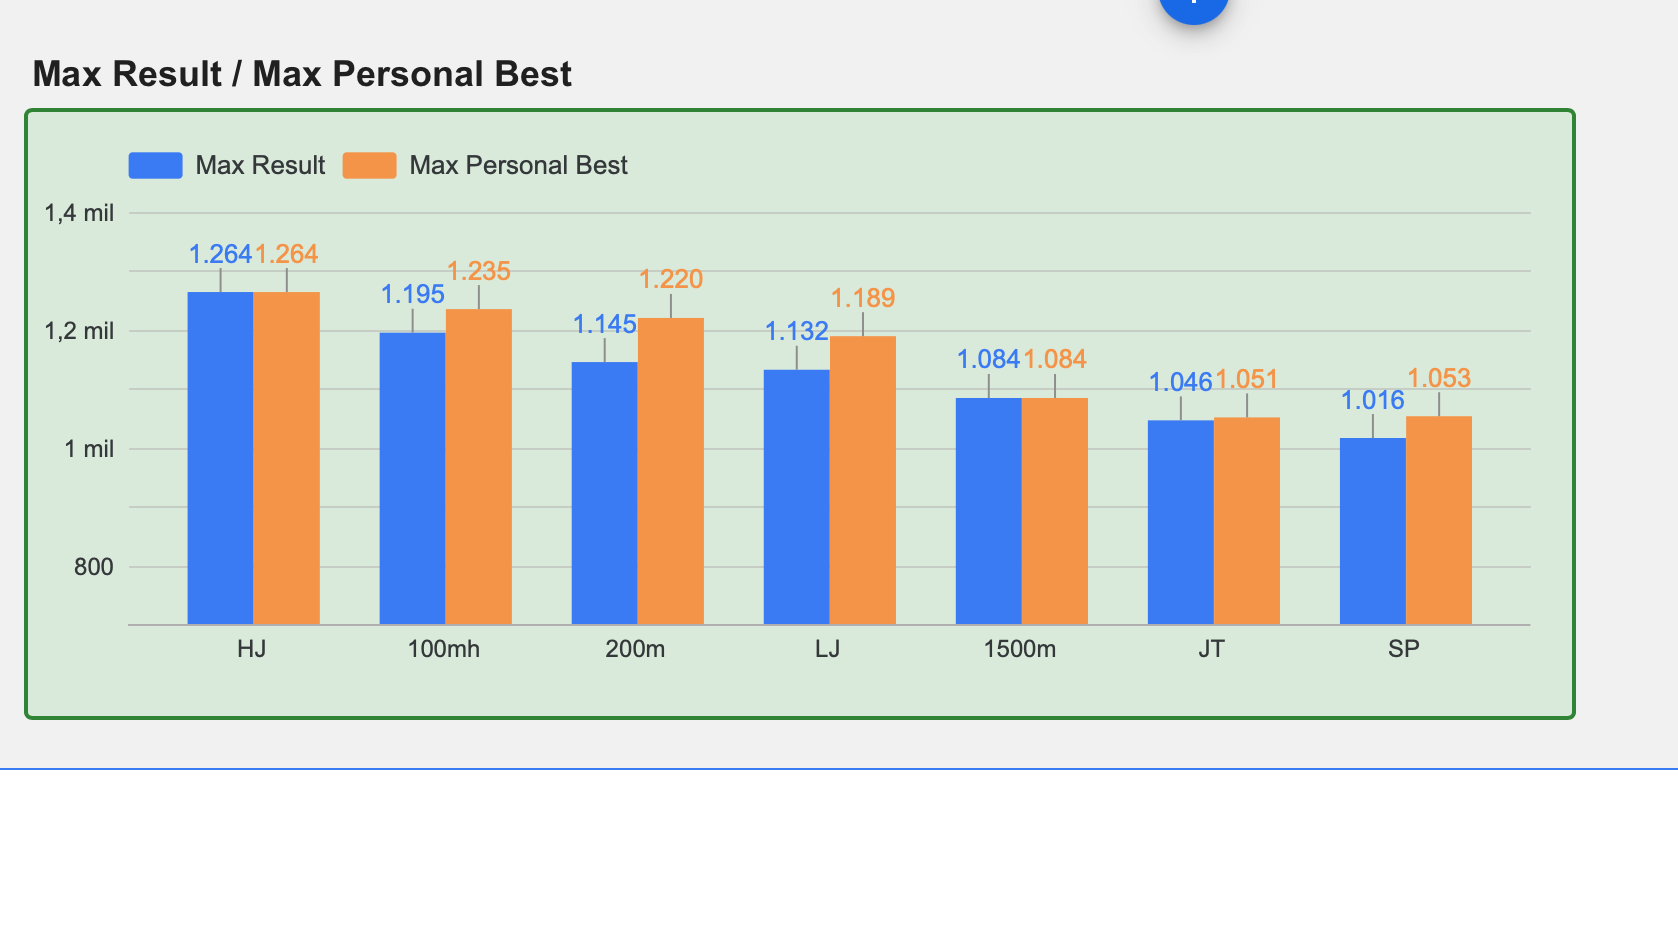
Report page 7: Events top 10 marks
Here, we present the ranking of performances both in their standard units and in Hungarian points, with the option to filter by event and by the number of athletes included in the analysis.
The bar chart displays the best result achieved in each event, together with the personal best performance of the athletes included in the analysis for each discipline.
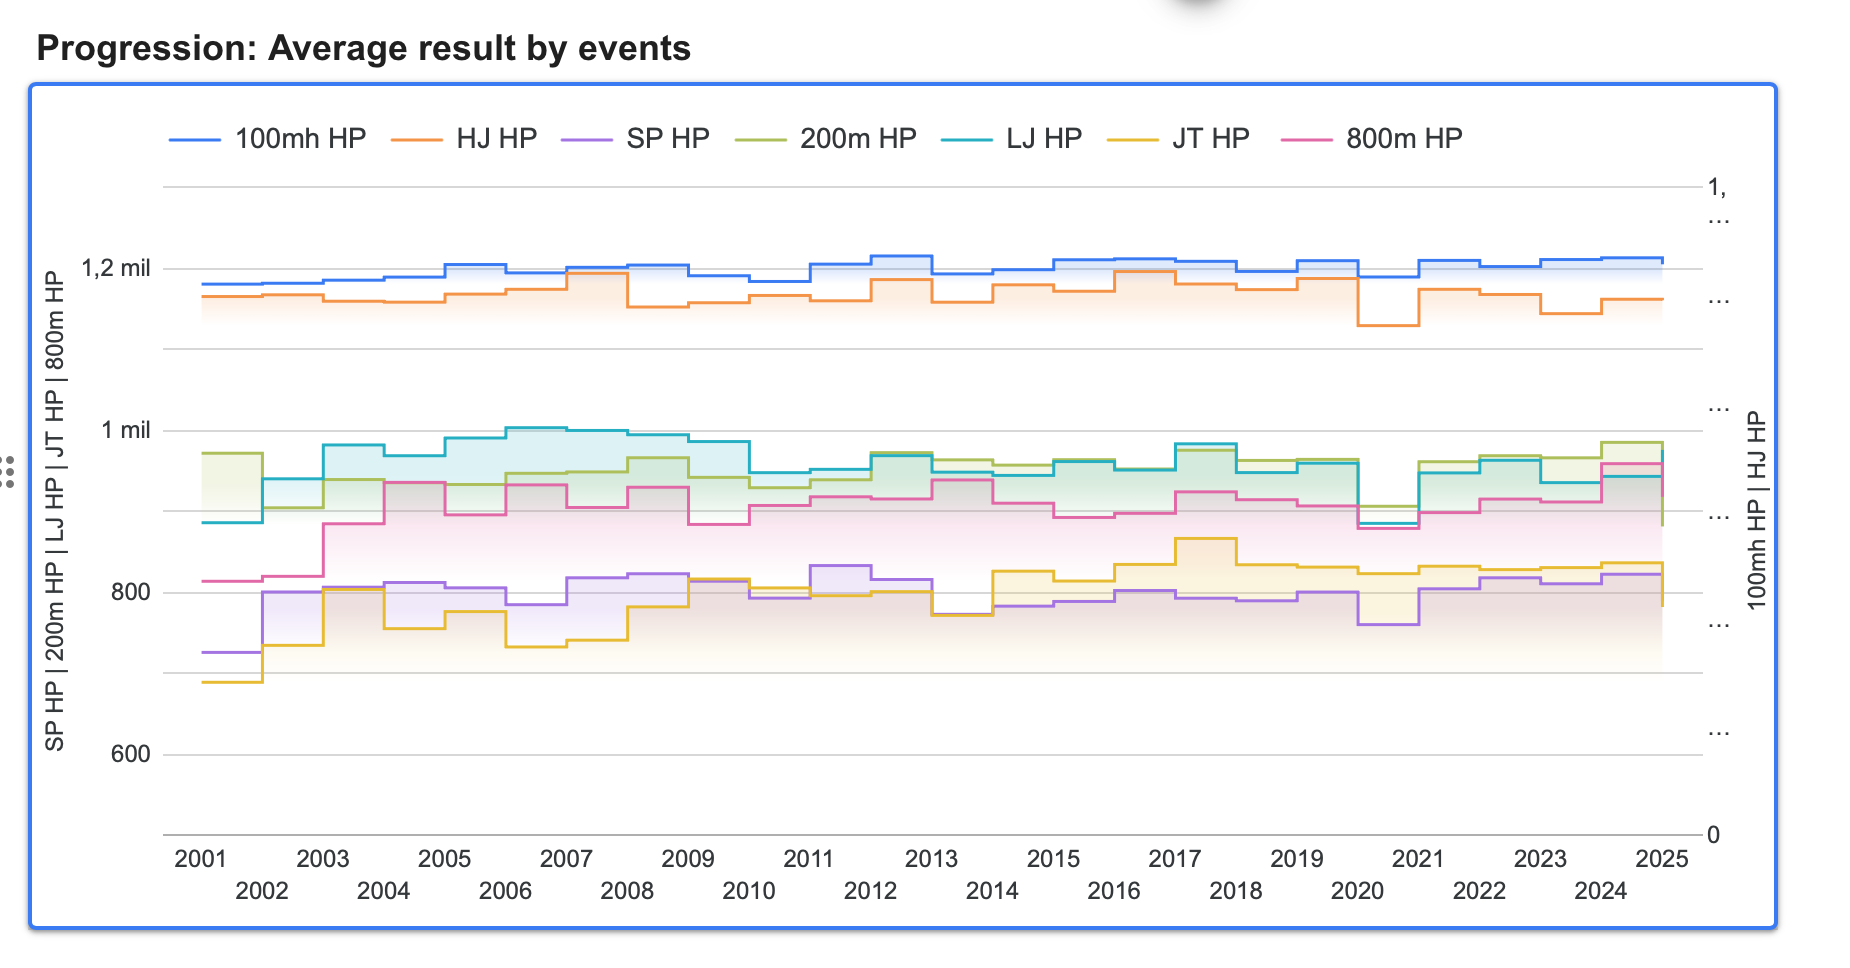
Report page 8: Progression of Event Results
On this page, we present a line chart showing the evolution of the events over the 25 years covered by the analysis. The displayed data represent the average values corresponding to the selection made using the dropdown controls above.
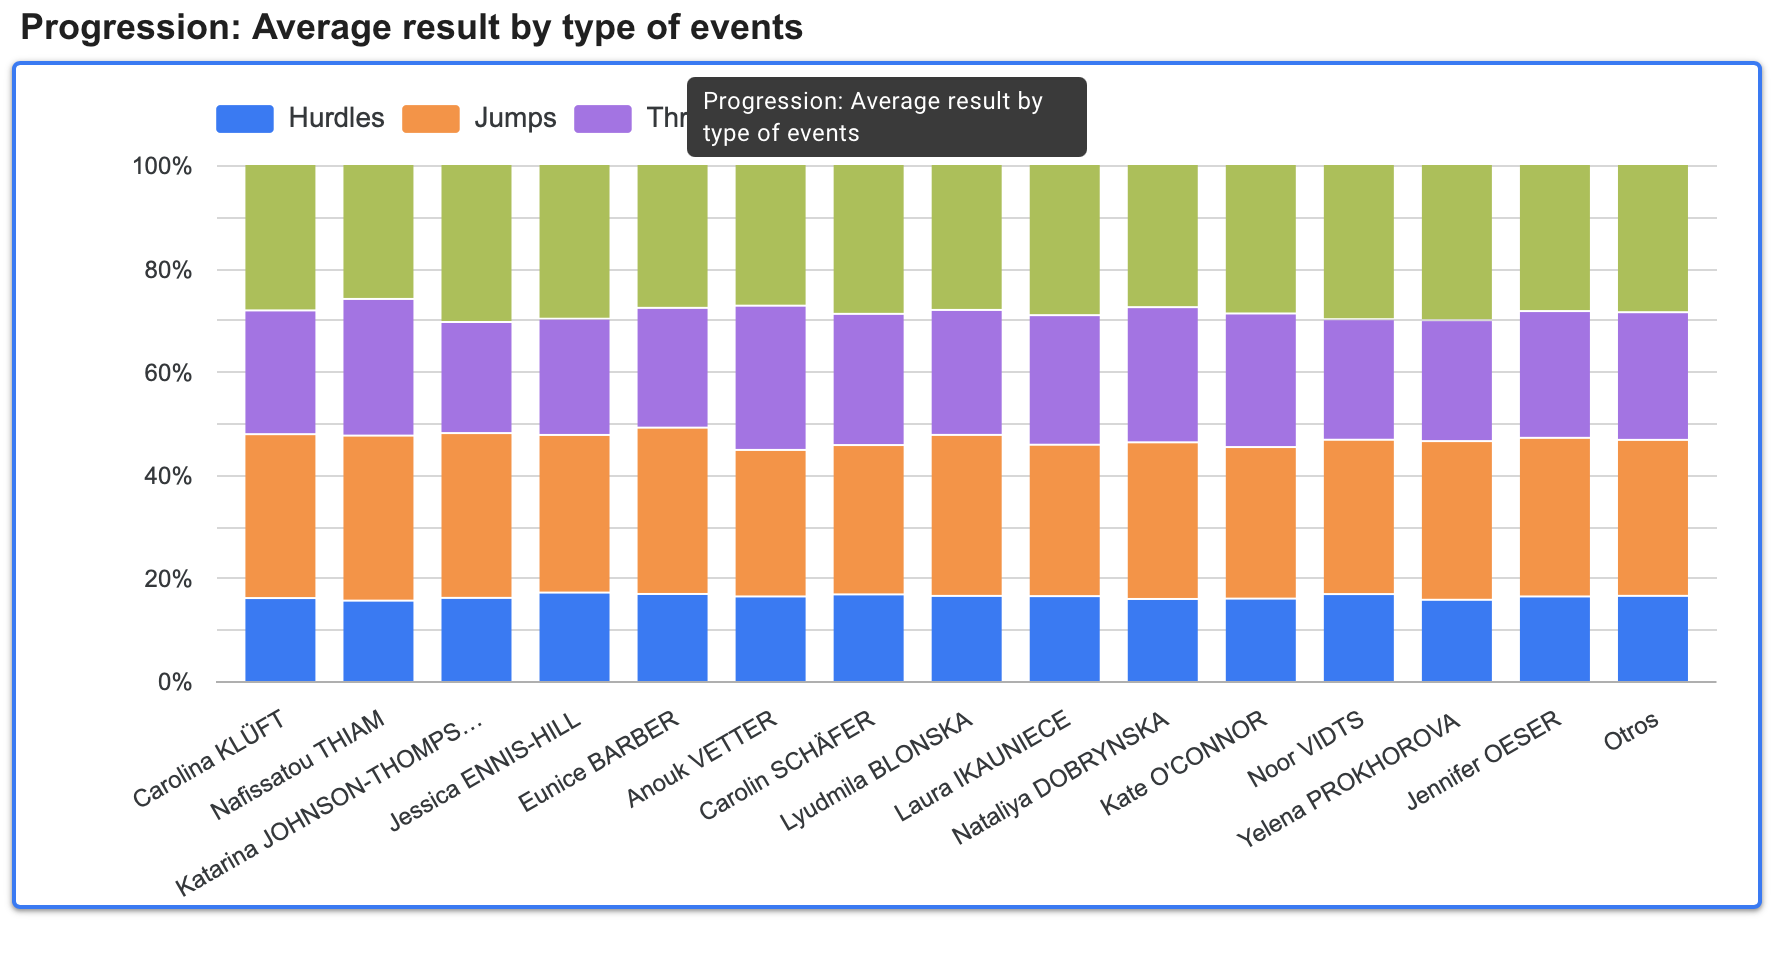
Next, we group the events by category—jumps, throws, running events, and hurdles—and display the top 15 athletes (depending on the selected filters) using stacked bar charts that illustrate the contribution of each event type.
CONCLUSION
This is all for now. We hope you found this analysis of interest. Any questions regarding the data modeling, as well as any suggestions, are most welcome.
We encourage you to leave your comments. Thank you.